by Calculated Risk on 11/29/2023 07:00:00 AM
Wednesday, November 29, 2023
MBA: Mortgage Applications Increased in Weekly Survey
From the MBA: Mortgage Applications Increase in Latest MBA Weekly Survey
— Mortgage applications increased 0.3 percent from one week earlier, according to data from the Mortgage Bankers Association’s (MBA) Weekly Mortgage Applications Survey for the week ending November 24, 2023. This week’s results include an adjustment for the observance of the Thanksgiving holiday.
The Market Composite Index, a measure of mortgage loan application volume, increased 0.3 percent on a seasonally adjusted basis from one week earlier. On an unadjusted basis, the Index decreased 33 percent compared with the previous week. The Refinance Index decreased 9 percent from the previous week and was 1 percent higher than the same week one year ago. The seasonally adjusted Purchase Index increased 5 percent from one week earlier. The unadjusted Purchase Index decreased 31 percent compared with the previous week and was 19 percent lower than the same week one year ago.
“Mortgage rates decreased for the fourth time in five weeks, with the 30-year fixed rate dipping to 7.37 percent, the lowest level in 10 weeks. There was a slight increase in applications overall, driven by a five percent increase in purchase applications, but refinance applications decreased over the week,” said Joel Kan, MBA’s Vice President and Deputy Chief Economist. “Rates have declined more than 50 basis points over the past six weeks, which has helped to spur a small increase in purchase applications, but activity last week was still around 20 percent lower than a year ago. The purchase market remains depressed because of the ongoing, low supply of existing homes on the market. Similarly, refinance activity will likely be muted for some time, even with the recent decline in rates, as many borrowers locked in much lower rates in 2020 and 2021.”
...
The average contract interest rate for 30-year fixed-rate mortgages with conforming loan balances ($726,200 or less) decreased to 7.37 percent from 7.41 percent, with points increasing to 0.64 from 0.62 (including the origination fee) for 80 percent loan-to-value ratio (LTV) loans.
emphasis added
 Click on graph for larger image.
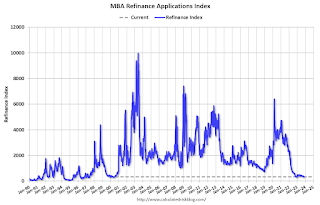
The first graph shows the MBA mortgage purchase index.
According to the MBA, purchase activity is down 19% year-over-year unadjusted.
Tuesday, November 28, 2023
Wednesday: GDP, Beige Book
by Calculated Risk on 11/28/2023 07:43:00 PM

Wednesday:
• At 7:00 AM ET, The Mortgage Bankers Association (MBA) will release the results for the mortgage purchase applications index.
• At 8:30 AM, Gross Domestic Product (Second Estimate) and Corporate Profits (Preliminary), 3rd Quarter 2023. The consensus is that real GDP increased 5.0% annualized in Q3, up from the advance estimate of 4.9% in Q3.
• At 2:00 PM, the Federal Reserve Beige Book, an informal review by the Federal Reserve Banks of current economic conditions in their Districts.
FHFA Announces Baseline Conforming Loan Limit Will Increase to $766,550
by Calculated Risk on 11/28/2023 12:21:00 PM
High-Cost Areas increase to $1,149,825.
Here is the official announcement from the FHFA: FHFA Announces Conforming Loan Limit Values for 2024
The Federal Housing Finance Agency (FHFA) today announced the conforming loan limit values (CLLs) for mortgages Fannie Mae and Freddie Mac (the Enterprises) will acquire in 2024. In most of the United States, the 2024 CLL value for one-unit properties will be $766,550, an increase of $40,350 from 2023.
...
The new ceiling loan limit for one-unit properties will be $1,149,825, which is 150 percent of $766,550.
emphasis added
Comments on September Case-Shiller and FHFA House Prices
by Calculated Risk on 11/28/2023 09:49:00 AM
Today, in the Calculated Risk Real Estate Newsletter: Case-Shiller: National House Price Index Up 3.9% year-over-year in September; New all-time High
Excerpt:
S&P/Case-Shiller released the monthly Home Price Indices for September ("September" is a 3-month average of July, August and September closing prices). September closing prices include some contracts signed in May, so there is a significant lag to this data. Here is a graph of the month-over-month (MoM) change in the Case-Shiller National Index Seasonally Adjusted (SA).
The MoM increase in the seasonally adjusted Case-Shiller National Index was at 0.65%. This was the eighth consecutive MoM increase following seven straight MoM decreases.
On a seasonally adjusted basis, prices increased in all 20 Case-Shiller cities on a month-to-month basis. Seasonally adjusted, San Francisco has fallen 8.6% from the recent peak, Seattle is down 6.7% from the peak, Las Vegas is down 5.1%, and Phoenix is down 5.0%.
Case-Shiller: National House Price Index Up 3.9% year-over-year in September; New all-time High
by Calculated Risk on 11/28/2023 09:00:00 AM
S&P/Case-Shiller released the monthly Home Price Indices for September ("September" is a 3-month average of July, August and September closing prices).
This release includes prices for 20 individual cities, two composite indices (for 10 cities and 20 cities) and the monthly National index.
From S&P S&P CoreLogic Case-Shiller Index Continued to Trend Upward in September
The S&P CoreLogic Case-Shiller U.S. National Home Price NSA Index, covering all nine U.S. census divisions, reported a 3.9% annual change in September, up from a 2.5% change in the previous month. The 10-City Composite showed an increase of 4.8%, up from a 3.0% increase in the previous month. The 20-City Composite posted a year-over-year increase of 3.9%, up from a 2.1% increase in the previous month. Detroit surpassed Chicago, reporting the highest year-over-year gain among the 20 cities with an 6.7% increase in September, followed by San Diego with a 6.5% increase. Three of the 20 cities reported lower prices in September versus a year ago.
...
Before seasonal adjustment, the U.S. National Index,10-City and 20-City Composites, all posted 0.3% month-over-month increases in September, while the 10-City and 20-City composites posted 0.3% and 0.2% increases, respectively.
After seasonal adjustment, the U.S. National Index, the 10-City and 20-City Composites each posted month-over-month increases of 0.7%.
“U.S. home prices continued their rally in September 2023,” says Craig J. Lazzara, Managing Director at S&P DJI. “Our National Composite rose by 0.3% in September, marking eight consecutive monthly gains since prices bottomed in January 2023. The Composite now stands 3.9% above its year-ago level and 6.6% above its January level. Our 10- and 20-City Composites both rose in September, and likewise currently exceed their year-ago and January levels.
“We’ve commented before on the breadth of the housing market’s strength, which continued to be impressive. On a seasonally adjusted basis, all 20 cities showed price increases in September; before seasonal adjustments, 15 rose. Prices in 17 of the cities are higher than they were in September 2022. Notably, the National Composite, the 10-City Composite, and 10 individual cities (Atlanta, Boston, Charlotte, Chicago, Cleveland, Detroit, Miami, New York, Tampa, and Washington) stand at their all-time highs."
 Click on graph for larger image.
 The first graph shows the nominal seasonally adjusted Composite 10, Composite 20 and National indices (the Composite 20 was started in January 2000).
The Composite 10 index is up 0.7% in September (SA) and is at a new all-time high.
The Composite 20 index is up 0.7% (SA) in September and is also at a new all-time high.
The National index is up 0.7% (SA) in September and is also at a new all-time high.
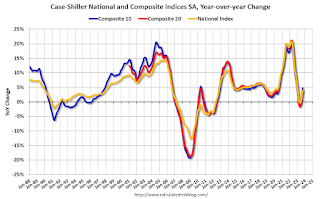 The second graph shows the year-over-year change in all three indices.
The Composite 10 SA is up 4.8% year-over-year. The Composite 20 SA is up 3.9% year-over-year.
The National index SA is up 3.9% year-over-year.
Annual price changes were close to expectations. I'll have more later.
Monday, November 27, 2023
Tuesday: Case-Shiller House Prices
by Calculated Risk on 11/27/2023 07:06:00 PM
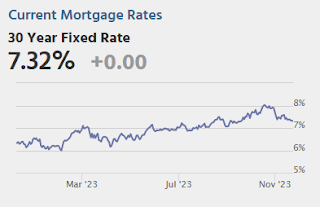
n other words, the bond market pointed to a moderate jump in rates on Friday. There was a good chance the jump was an artificial byproduct of Thanksgiving week, but there was no way to be sure until today.Tuesday:
Now we're sure. Bonds quickly moved back in line with Wednesday's levels and the average mortgage lender did the same. That's good news considering last Wednesday's mortgage rates were right in line with the lowest levels of the past 2 months. [30 year fixed 7.32%]
emphasis added
• At 9:00 AM ET, S&P/Case-Shiller House Price Index for September. The National index was up 2.6% YoY in August and is expected to increase further in September.
• At 9:00 AM, FHFA House Price Index for September. This was originally a GSE only repeat sales, however there is also an expanded index. The 2023 Conforming loan limits will also be announced.
• At 10:00 AM, Richmond Fed Survey of Manufacturing Activity for November. This is the last of the regional Fed manufacturing surveys for November.
TSA: Airline Travel Above 2019 Levels
by Calculated Risk on 11/27/2023 02:32:00 PM
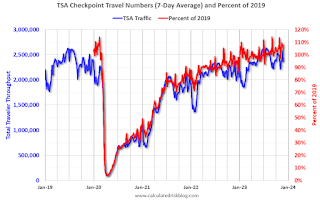
The TSA is providing daily travel numbers.
This data is as of November 26th.
 Click on graph for larger image.
This data shows the 7-day average of daily total traveler throughput from the TSA (Blue).
The red line is the percent of 2019 for the seven-day average.
The 7-day average is above the level for the same week in 2019 (104% of 2019). (red line) The 7-day average has been above 2019
New Home Sales decrease to 679,000 Annual Rate in October; Median New Home Price is Down 18% from the Peak
by Calculated Risk on 11/27/2023 10:44:00 AM
Today, in the Calculated Risk Real Estate Newsletter: New Home Sales decrease to 679,000 Annual Rate in October
Brief excerpt:
The Census Bureau reports New Home Sales in October were at a seasonally adjusted annual rate (SAAR) of 679 thousand. The previous three months were revised down.You can subscribe at https://calculatedrisk.substack.com/.
...
The next graph shows new home sales for 2022 and 2023 by month (Seasonally Adjusted Annual Rate). Sales in October 2023 were up 17.7% from October 2022. Year-to-date sales are up 4.6% compared to the same period in 2022.
As expected, new home sales were up solidly year-over-year in October, and there will be more sales in 2023 than in 2022.
New Home Sales decrease to 679,000 Annual Rate in October
by Calculated Risk on 11/27/2023 10:00:00 AM
The Census Bureau reports New Home Sales in October were at a seasonally adjusted annual rate (SAAR) of 679 thousand.
The previous three months were revised down.
Sales of new single‐family houses in October 2023 were at a seasonally adjusted annual rate of 679,000, according to estimates released jointly today by the U.S. Census Bureau and the Department of Housing and Urban Development. This is 5.6 percent below the revised September rate of 719,000, but is 17.7 percent above the October 2022 estimate of 577,000.
emphasis added
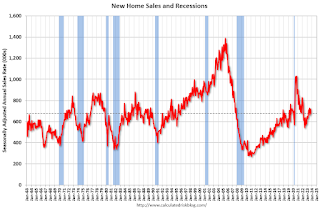 Click on graph for larger image.
The first graph shows New Home Sales vs. recessions since 1963. The dashed line is the current sales rate.
New home sales are close to pre-pandemic levels.
The second graph shows New Home Months of Supply.
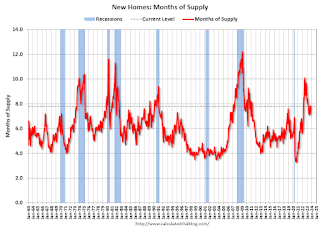 The months of supply increased in October to 7.8 months from 7.2 months in September.
 The all-time record high was 12.2 months of supply in January 2009. The all-time record low was 3.3 months in August 2020.
This is above the top of the normal range (about 4 to 6 months of supply is normal).
"The seasonally‐adjusted estimate of new houses for sale at the end of October was 439,000. This represents a supply of 7.8 months at the current sales rate."Sales were well below expectations of 730 thousand SAAR, and sales for the three previous months were revised down. I'll have more later today.
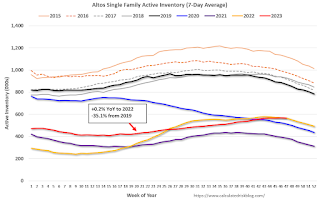
Housing November 27th Weekly Update: Inventory Down Week-over-week, Up Slightly Year-over-year
by Calculated Risk on 11/27/2023 08:11:00 AM
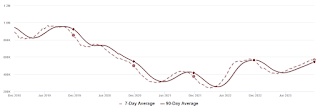 Click on graph for larger image.
This inventory graph is courtesy of Altos Research.
