by Calculated Risk on 12/01/2023 04:00:00 PM
Friday, December 01, 2023
Q4 GDP Tracking: Close to 1%
From BofA:
Overall, since our last weekly publication, our 4Q US GDP tracking estimate fell three-tenths to 1.0% q/q saar. [Dec 1st estimate]From Goldman:
emphasis added
We boosted our Q4 GDP tracking estimate by one tenth to +1.5% (qoq ar) and our Q4 domestic final sales growth forecast by the same amount to +2.1% (qoq ar). [Dec 1st estimate]And from the Altanta Fed: GDPNow
The GDPNow model estimate for real GDP growth (seasonally adjusted annual rate) in the fourth quarter of 2023 is 1.2 percent on December 1, down from 1.8 percent on November 30. [Dec 1st estimate]
CES Strike Report: Ending Strikes will Boost November Employment
by Calculated Risk on 12/01/2023 01:51:00 PM
 This shows a total of 10,500 workers on strike in November, down from 48,100 in October.
Inflation Adjusted House Prices 3.0% Below Peak; Price-to-rent index is 6.9% below recent peak
by Calculated Risk on 12/01/2023 11:09:00 AM
Today, in the Calculated Risk Real Estate Newsletter: Inflation Adjusted House Prices 3.0% Below Peak; Price-to-rent index is 6.9% below recent peak
Excerpt:
It has been over 17 years since the bubble peak. In the September Case-Shiller house price index released this week, the seasonally adjusted National Index (SA), was reported as being 69% above the bubble peak in 2006. However, in real terms, the National index (SA) is about 10% above the bubble peak (and historically there has been an upward slope to real house prices). The composite 20, in real terms, is at the bubble peak.
People usually graph nominal house prices, but it is also important to look at prices in real terms. As an example, if a house price was $300,000 in January 2010, the price would be $424,000 today adjusted for inflation (41% increase). That is why the second graph below is important - this shows "real" prices.
The third graph shows the price-to-rent ratio, and the fourth graph is the affordability index. The last graph shows the 5-year real return based on the Case-Shiller National Index.
...
The second graph shows the same two indexes in real terms (adjusted for inflation using CPI).
In real terms (using CPI), the National index is 3.0% below the recent peak, and the Composite 20 index is 3.9% below the recent peak in 2022.
In real terms, national house prices are 9.4% above the bubble peak levels. There is an upward slope to real house prices, and it has been about 17 years since the previous peak, but real prices are historically high.
Construction Spending Increased 0.6% in October
by Calculated Risk on 12/01/2023 10:17:00 AM
From the Census Bureau reported that overall construction spending increased:
Construction spending during October 2023 was estimated at a seasonally adjusted annual rate of $2,027.1 billion, 0.6 percent above the revised September estimate of $2,014.7 billion. The October figure is 10.7 percent above the October 2022 estimate of $1,830.5 billion.Both private and public spending increased:
emphasis added
Spending on private construction was at a seasonally adjusted annual rate of $1,579.3 billion, 0.7 percent above the revised September estimate of $1,567.9 billion. ...
In October, the estimated seasonally adjusted annual rate of public construction spending was $447.8 billion, 0.2 percent above the revised September estimate of $446.9 billion.
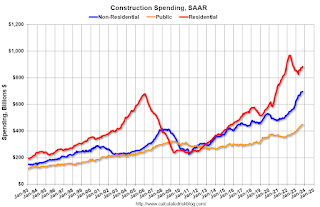
 Click on graph for larger image.
This graph shows private residential and nonresidential construction spending, and public spending, since 1993. Note: nominal dollars, not inflation adjusted.
Residential (red) spending is 8.8% below the recent peak.
Non-residential (blue) spending is at a new peak.
Public construction spending is also at a new peak.
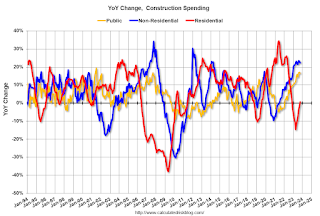
 The second graph shows the year-over-year change in construction spending.
On a year-over-year basis, private residential construction spending is up 0.7%. Non-residential spending is up 22.4% year-over-year. Public spending is up 16.4% year-over-year.
ISM® Manufacturing index Unchanged at 46.7% in November
by Calculated Risk on 12/01/2023 10:00:00 AM
(Posted with permission). The ISM manufacturing index indicated contraction. The PMI® was at 46.7% in November, unchanged from 46.7% in October. The employment index was at 45.8%, down from 46.8% the previous month, and the new orders index was at 48.3%, up from 45.5%.
From ISM: Manufacturing PMI® at 46.7% November 2023 Manufacturing ISM® Report On Business®
Economic activity in the manufacturing sector contracted in November for the 13th consecutive month following a 28-month period of growth, say the nation's supply executives in the latest Manufacturing ISM® Report On Business®.This suggests manufacturing contracted in November. This was below the consensus forecast.
The report was issued today by Timothy R. Fiore, CPSM, C.P.M., Chair of the Institute for Supply Management® (ISM®) Manufacturing Business Survey Committee:
“The Manufacturing PMI® registered 46.7 percent in November, unchanged from the 46.7 percent recorded in October. The overall economy continued in contraction for a second month after one month of weak expansion preceded by nine months of contraction and a 30-month period of expansion before that. (A Manufacturing PMI® above 48.7 percent, over a period of time, generally indicates an expansion of the overall economy.) The New Orders Index remained in contraction territory at 48.3 percent, 2.8 percentage points higher than the figure of 45.5 percent recorded in October. The Production Index reading of 48.5 percent is a 1.9-percentage point decrease compared to October’s figure of 50.4 percent. The Prices Index registered 49.9 percent, up 4.8 percentage points compared to the reading of 45.1 percent in October. The Backlog of Orders Index registered 39.3 percent, 2.9 percentage points lower than the October reading of 42.2 percent. The Employment Index registered 45.8 percent, down 1 percentage point from the 46.8 percent reported in October.
emphasis added
Thursday, November 30, 2023
Friday: ISM Mfg, Construction Spending, Fed Chair Powell, Vehicle Sales
by Calculated Risk on 11/30/2023 08:34:00 PM

Friday:
• At 10:00 AM ET, ISM Manufacturing Index for November. The consensus is for 47.7%, up from 46.7%.
• Also at 10:00 AM, Construction Spending for October. The consensus is for 0.4% increase in spending.
• At 11:00 AM, Discussion, Fed Chair Jerome Powell, Conversation with Spelman College President Helene Gayle, At a Fireside Chat at Spelman College, Atlanta, Ga.
• All day, Light vehicle sales for November. The consensus is for 15.5 million SAAR in November, unchanged from the BEA estimate of 15.5 million SAAR in October (Seasonally Adjusted Annual Rate).
Las Vegas October 2023: Visitor Traffic Down Slightly YoY; Convention Traffic Up 2%
by Calculated Risk on 11/30/2023 04:07:00 PM
From the Las Vegas Visitor Authority: October 2023 Las Vegas Visitor Statistics
Demand for sports, entertainment and conventions combined to lift room rates to record levels in October as the destination hosted more than 3.6M visitors. Complementing the signature shows and residencies of the destination were other headliner acts including P!NK, the When We Were Young music festival and Ed Sheeran, along with the Fall NASCAR race and two NFL Raider home games.
Convention attendance for the month was up 2.0% YoY, supported by various returning and rotating tradeshows as well as the TwitchCon gamers event (30k attendees) that was held in Las Vegas for the first time.
Overall hotel occupancy matched last October at 87.7% as Weekend occupancy came in at 94.2% (+0.2 pts YoY), and Midweek occupancy reached 85.4% (up 0.3 pts), and ADR and RevPAR set records at $233 and $204 respectively, beating the prior monthly record tallies from March 2023
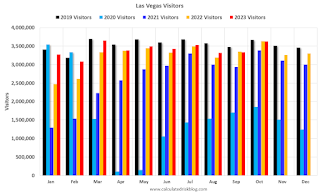
 Click on graph for larger image.
 The first graph shows visitor traffic for 2019 (Black), 2020 (light blue), 2021 (purple), 2022 (orange), and 2023 (red).
Visitor traffic was down 0.2% compared to last October.
Note: There was almost no convention traffic from April 2020 through May 2021.
Realtor.com Reports Active Inventory UP 1.8% YoY; New Listings up 8.9% YoY
by Calculated Risk on 11/30/2023 02:31:00 PM
Realtor.com has monthly and weekly data on the existing home market. Here is their weekly report: Weekly Housing Trends View — Data Week Ending Nov 25, 2023
• Active inventory increased slightly, with for-sale homes 1.8% above year ago levels.
Active listings exceeded last year’s levels again this week, growing by a slightly higher rate than previous week (+1.8% year-over-year vs +1.5%). However, active inventory has now fallen below its peak of 758,000 listings two weeks ago, to 741,000 this past week.
• New listings–a measure of sellers putting homes up for sale–were up this week, by 8.9% from one year ago.
New listings registered lower than prior year levels from mid-2022 through roughly 5 weeks ago, as the mortgage rate lock-in effect froze homeowners with low-rate existing mortgages in place. More recently the trend has reversed as new listings during the week outpaced the same week in the previous year by 8.9%, the largest increase since summer 2021. With the number of homes for sale already limited, a pick up in new listings is a welcome change to recent inventory woes. However, the pace of new listings is still 16.9% below typical pre-pandemic levels.
 Here is a graph of the year-over-year change in inventory according to realtor.com.
 Inventory was up year-over-year for the 2rd consecutive week following 20 consecutive weeks with a YoY decrease in inventory.
Freddie Mac House Price Index Increased in October to New High; Up 6.0% Year-over-year
by Calculated Risk on 11/30/2023 11:01:00 AM
Today, in the Calculated Risk Real Estate Newsletter: Freddie Mac House Price Index Increased in October to New High; Up 6.0% Year-over-year
A brief excerpt:
On a year-over-year basis, the National FMHPI was up 6.0% in October, from up 5.1% YoY in September. The YoY increase peaked at 19.1% in July 2021, and for this cycle, bottomed at up 0.9% in April 2023. ...There is much more in the article. You can subscribe at https://calculatedrisk.substack.com/
As of October, 7 states and D.C. were below their previous peaks, Seasonally Adjusted. The largest seasonally adjusted declines from the recent peak were in Idaho (-4.5%), Utah (-2.7%), D.C. (-2.0%), and Nevada (-1.6%).
For cities (Core-based Statistical Areas, CBSA), here are the 30 cities with the largest declines from the peak, seasonally adjusted. Austin continues to be the worst performing city.
...
I’ll have an update on the House Price Battle Royale: Low Inventory vs Affordability soon.
NAR: Pending Home Sales Decrease 1.5% in October; Down 8.5% Year-over-year; Lowest Number of Record
by Calculated Risk on 11/30/2023 10:00:00 AM
From the NAR: Pending Home Sales Fell 1.5% in October
Pending home sales dropped 1.5% in October, according to the National Association of REALTORS®. The Northeast posted a monthly gain in transactions while the Midwest, South and West all recorded losses. All four U.S. regions noted year-over-year declines in transactions.This was below expectations. Note: Contract signings usually lead sales by about 45 to 60 days, so this would usually be for closed sales in November and December.
The Pending Home Sales Index (PHSI)* – a forward-looking indicator of home sales based on contract signings – dropped 1.5% to 71.4 in October, the lowest number since the index was originated in 2001. Year over year, pending transactions declined 8.5%. An index of 100 is equal to the level of contract activity in 2001.
...
The Northeast PHSI jumped 2.7% from last month to 64.8, although representing a loss of 6.5% from October 2022. The Midwest index contracted 0.4% to 73.8 in October, down 10.3% from one year ago.
The South PHSI decreased 1.9% to 85.6 in October, declining 7.1% from the prior year. The West index fell 6.0% in October to 51.8, dipping 10.8% from October 2022.
emphasis added


