 RSS Feed
 by Calculated Risk on 12/04/2023 07:06:00 PM
Monday, December 04, 2023
Tuesday: Job Openings, ISM Services
 From Matthew Graham at Mortgage News Daily: Mortgage Rates Move Slightly Higher, But Still Effectively at 3-Month Lows
Apart from this past Friday, you'd have to go back to September 1st to see lower mortgage rates than today. ... the incoming economic data has the potential to send rates significantly higher or lower. ... The first key report is CPI, the consumer price index, which serves as the most widely traded update on inflation. The last release was on November 14th and it sent rates quickly lower. [30 year fixed 7.11%]Tuesday:
emphasis added
• At 8:00 AM ET, Corelogic House Price index for October.
• At 10:00 AM, Job Openings and Labor Turnover Survey for October from the BLS.
• Also at 10:00 AM, the ISM Services Index for November. The consensus is for 52.5, up from 51.8.
Update: Lumber Prices Up Slightly YoY
by Calculated Risk on 12/04/2023 01:42:00 PM
Here is another monthly update on lumber prices.
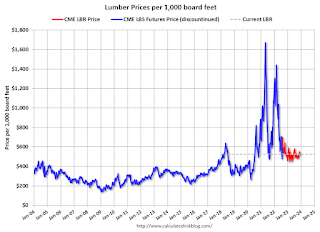
Unfortunately, this impacts long term price comparisons since the new contract was priced about 24% higher than the old random length contract for the period both contracts were available.
This graph shows CME random length framing futures through last August (blue), and the new physically-delivered Lumber Futures (LBR) contract starting in August 2022 (Red).
 Click on graph for larger image.
We didn't see a significant runup in prices this Spring due to the housing slowdown.
This graph shows CME random length framing futures through last August (blue), and the new physically-delivered Lumber Futures (LBR) contract starting in August 2022 (Red).
LBR is currently at $525.00 per 1000 board feet, up 2% from $515.00 a year ago.
 Click on graph for larger image.
There is somewhat of a seasonal demand for lumber, and lumber prices usually peak in April or May.
We didn't see a significant runup in prices this Spring due to the housing slowdown.
ICE (Black Knight) Mortgage Monitor: "Home prices continued sending mixed signals in October"
by Calculated Risk on 12/04/2023 10:12:00 AM
Today, in the Calculated Risk Real Estate Newsletter: IICE (Black Knight) Mortgage Monitor: "Home prices continued sending mixed signals in October"
A brief excerpt:
And on Florida inventory:There is much more in the article. You can subscribe at https://calculatedrisk.substack.com/
Florida has experienced some of the largest inventory gains in recent months
• In fact, six of the nine markets seeing the strongest inventory growth over the past three months – Palm Bay (+22pp), Lakeland (+21pp), Tampa (+19pp), Cape Coral (+18pp), North Port (+16pp) and Orlando (+14pp) – are located in the Sunshine State
• Inventory in Lakeland is now 15% above 2017-2019 averages, surpassing Austin for the largest surplus of homes for sale compared to prepandemic levels
• While Miami has also shown inventory improvements it continues to have the deepest inventory deficit in the state with 42% fewer homes for sale compared to 2017-2019 same-month averages, in line with the national average
• Florida will be worth watching in coming months to determine if rising inventory levels lead to softening prices
emphasis added

Housing December 4th Weekly Update: Inventory Down 1.8% Week-over-week, Up 1.0% Year-over-year
by Calculated Risk on 12/04/2023 08:16:00 AM
Altos reports that active single-family inventory was down 1.8% week-over-week and is now up 1.0% year-over-year. Inventory will decrease seasonally for next several weeks (for the Holidays).
 Click on graph for larger image.
This inventory graph is courtesy of Altos Research.
As of December 1st, inventory was at 556 thousand (7-day average), compared to 566 thousand the prior week.
Year-to-date, inventory is up 13.2%.

The red line is for 2023. The black line is for 2019. Note that inventory is up from the record low for the same week in 2021, but below last year and still well below normal levels.
Inventory was up 1.0% compared to the same week in 2022 (last week it was up 0.2%), and down 34.9% compared to the same week in 2019 (last week down 35.1%).
Inventory is now solidly above the same week in 2020 levels (dark blue line).
Mike Simonsen discusses this data regularly on Youtube.
Sunday, December 03, 2023
Sunday Night Futures
by Calculated Risk on 12/03/2023 11:40:00 PM
Weekend:
• Schedule for Week of December 3, 2023
Monday:
• No major economic releases scheduled.
From CNBC: Pre-Market Data and Bloomberg futures S&P 500 futures are down 7 and DOW futures are up 22 (fair value).
Oil prices were down over the last week with WTI futures at $74.07 per barrel and Brent at $78.88 per barrel. A year ago, WTI was at $80, and Brent was at $87 - so WTI oil prices were down 7% year-over-year.
Here is a graph from Gasbuddy.com for nationwide gasoline prices. Nationally prices are at $3.23 per gallon. A year ago, prices were at $3.37 per gallon, so gasoline prices are down $0.14 year-over-year.
Hotels: Occupancy Rate Decreased 1.4% Year-over-year
by Calculated Risk on 12/03/2023 09:33:00 AM
As expected due to the Thanksgiving holiday, U.S. hotel performance fell from the previous week, according to CoStar’s latest data through 25 November. ...The following graph shows the seasonal pattern for the hotel occupancy rate using the four-week average.
19-25 November 2023 (percentage change from comparable week in 2022):
• Occupancy: 49.4% (-1.4%)
• Average daily rate (ADR): US$138.29 (+0.9%)
• Revenue per available room (RevPAR): US$68.32 (-0.6%)
emphasis added
 Click on graph for larger image.
The red line is for 2023, black is 2020, blue is the median, and dashed light blue is for 2022. Dashed purple is for 2018, the record year for hotel occupancy.
The 4-week average of the occupancy rate is tracking close to last year, and above the median rate for the period 2000 through 2022 (Blue).
Note: Y-axis doesn't start at zero to better show the seasonal change.
The 4-week average of the occupancy rate will decline seasonally until early 2024.
Saturday, December 02, 2023
Real Estate Newsletter Articles this Week: New Home Sales decrease to 679,000 Annual Rate in October
by Calculated Risk on 12/02/2023 02:11:00 PM
At the Calculated Risk Real Estate Newsletter this week:
• New Home Sales decrease to 679,000 Annual Rate in October
• Case-Shiller: National House Price Index Up 3.9% year-over-year in September; New all-time High
• Freddie Mac House Price Index Increased in October to New High; Up 6.0% Year-over-year
• Fannie and Freddie Serious Delinquencies in October: Single Family Declined, Multi-Family Increased
• Final Look at Local Housing Markets in October
• Inflation Adjusted House Prices 3.0% Below Peak
This is usually published 4 to 6 times a week and provides more in-depth analysis of the housing market.
You can subscribe at https://calculatedrisk.substack.com/
Schedule for Week of December 3, 2023
by Calculated Risk on 12/02/2023 08:11:00 AM
The key report this week is the November employment report on Friday.
No major economic releases scheduled.
8:00 AM: Corelogic House Price index for October.
 10:00 AM ET: Job Openings and Labor Turnover Survey for October from the BLS.
 This graph shows job openings (black line), hires (purple), Layoff, Discharges and other (red column), and Quits (light blue column) from the JOLTS.
Jobs openings increased in September to 9.55 million from 9.50 million in August.
10:00 AM: the ISM Services Index for November. The consensus is for 52.5, up from 51.8.
7:00 AM ET: The Mortgage Bankers Association (MBA) will release the results for the mortgage purchase applications index.
8:15 AM: The ADP Employment Report for November. This report is for private payrolls only (no government). The consensus is for 120,000 jobs added, up from 113,000 in October.
 8:30 AM: Trade Balance report for October from the Census Bureau.
 This graph shows the U.S. trade deficit, with and without petroleum, through the most recent report. The blue line is the total deficit, and the black line is the petroleum deficit, and the red line is the trade deficit ex-petroleum products.
The consensus is the trade deficit to be $63.0 billion. The U.S. trade deficit was at $61.5 billion in September.
8:30 AM: The initial weekly unemployment claims report will be released. The consensus is for 224 thousand, up from 218 thousand last week.
12:00 PM: Q3 Flow of Funds Accounts of the United States from the Federal Reserve.
 8:30 AM: Employment Report for November. The consensus is for 200,000 jobs added, and for the unemployment rate to be unchanged at 3.9%.
There were 150,000 jobs added in October, and the unemployment rate was at 3.9%.
This graph shows the jobs added per month since January 2021.
10:00 AM: University of Michigan's Consumer sentiment index (Preliminary for December).
Friday, December 01, 2023
Dec 1st COVID Update: Deaths and Hospitalizations Increased
by Calculated Risk on 12/01/2023 07:23:00 PM
 Note: Mortgage rates are from MortgageNewsDaily.com and are for top tier scenarios.
Due to changes at the CDC, weekly cases are no longer updated.
For deaths, I'm currently using 3 weeks ago for "now", since the most recent two weeks will be revised significantly.
Hospitalizations have more almost tripled from a low of 5,150 in June 2023.
Hospitalizations are far below the peak of 150,000 in January 2022.
| COVID Metrics | ||||
|---|---|---|---|---|
| Now | Week Ago | Goal | ||
| Hospitalized2🚩 | 15,290 | 14,127 | ≤3,0001 | |
| Deaths per Week2🚩 | 1,190 | 1,143 | ≤3501 | |
| 1my goals to stop weekly posts, 2Weekly for Currently Hospitalized, and Deaths 🚩 Increasing number weekly for Hospitalized and Deaths ✅ Goal met. | ||||
 Click on graph for larger image.
This graph shows the weekly (columns) number of deaths reported.
Weekly deaths have more than doubled from a low of 485 in early July but have declined recently. Weekly deaths are far below the weekly peak of 26,000 in January 2021.
And here is a new graph I'm following on COVID in wastewater:
 Note the recent surge in the Midwest.
This appears to be a leading indicator for COVID hospitalizations and deaths.
Vehicles Sales decrease to 15.32 million SAAR in November; Up 7% YoY
by Calculated Risk on 12/01/2023 05:08:00 PM
Wards Auto released their estimate of light vehicle sales for November: No Holiday Boost but U.S. Light-Vehicle Sales Continue Gains in November (pay site).
Labor-related plant shutdowns in the U.S. that covered the latter half of September and most of October negatively impacted deliveries in November. Combined sales of the vehicles impacted by shutdowns fell 15% year-over-year in November. If those vehicles had matched year-ago results, sales would have totaled a 15.9 million-unit SAAR. While CUVs accounted for over half the market for the second time ever, vehicles impacted by the strikes were largely behind weakness in pickups, SUVs and vans.
 Click on graph for larger image.
This graph shows light vehicle sales since 2006 from the BEA (blue) and Wards Auto's estimate for November (red).
The impact of COVID-19 was significant, and April 2020 was the worst month. After April 2020, sales increased, and were close to sales in 2019 (the year before the pandemic). However, sales decreased in 2021 due to supply issues. The "supply chain bottom" was in September 2021.
 The second graph shows light vehicle sales since the BEA started keeping data in 1967.
 Sales in November were below the consensus forecast due to the impact of the strikes.


