 RSS Feed
 by Calculated Risk on 12/05/2023 07:05:00 PM
Tuesday, December 05, 2023
Wednesday: ADP Employment, Trade Deficit
 Note: Mortgage rates are from MortgageNewsDaily.com and are for top tier scenarios.
Wednesday:
• At 7:00 AM ET, The Mortgage Bankers Association (MBA) will release the results for the mortgage purchase applications index.
• At 8:15 AM, The ADP Employment Report for November. This report is for private payrolls only (no government). The consensus is for 120,000 jobs added, up from 113,000 in October.
• At 8:30 AM, Trade Balance report for October from the Census Bureau. The consensus is the trade deficit to be $63.0 billion. The U.S. trade deficit was at $61.5 billion in September.
ISM® Services Index Increases to 52.7% in November
by Calculated Risk on 12/05/2023 04:17:00 PM
(Posted with permission). The ISM® Services index was at 52.7%, up from 51.8% last month. The employment index increased to 50.7%, from 50.2%. Note: Above 50 indicates expansion, below 50 in contraction.
From the Institute for Supply Management: Services PMI® at 52.7% November 2023 Services ISM® Report On Business®
Economic activity in the services sector expanded in November for the 11th consecutive month as the Services PMI® registered 52.7 percent, say the nation's purchasing and supply executives in the latest Services ISM® Report On Business®. The sector has grown in 41 of the last 42 months, with the lone contraction in December 2022.The PMI was slightly above expectations.
The report was issued today by Anthony Nieves, CPSM, C.P.M., A.P.P., CFPM, Chair of the Institute for Supply Management® (ISM®) Services Business Survey Committee: “In November, the Services PMI® registered 52.7 percent, 0.9 percentage point higher than October’s reading of 51.8 percent. The composite index indicated growth in November for the 11th consecutive month after a reading of 49.2 percent in December 2022, which was the first contraction since May 2020 (45.4 percent). The Business Activity Index registered 55.1 percent; a 1-percentage point increase compared to the reading of 54.1 percent in October. The New Orders Index expanded in November for the 11th consecutive month after contracting in December for the first time since May 2020; the figure of 55.5 percent equals the October reading.
emphasis added
Asking Rents Down 1.1% Year-over-year
by Calculated Risk on 12/05/2023 12:27:00 PM
Today, in the Calculated Risk Real Estate Newsletter: Asking Rents Down 1.1% Year-over-year
A brief excerpt:
Here is a graph of the year-over-year (YoY) change for these measures since January 2015. Most of these measures are through October 2023, except CoreLogic is through September and Apartment List is through November 2023.There is much more in the article. You can subscribe at https://calculatedrisk.substack.com/
The CoreLogic measure is up 2.6% YoY in September, down from 2.9% in August, and down from a peak of 13.9% in April 2022.
The Zillow measure is up 3.2% YoY in October, mostly unchanged from 3.2% YoY in September, and down from a peak of 16.1% YoY in March 2022.
The ApartmentList measure is down 1.1% YoY as of November, up from -1.2% in October, and down from a peak of 18.2% YoY November 2021.
...
OER and CPI shelter will decline further in the CPI release next week.

BLS: Job Openings Decreased to 8.7 million in October
by Calculated Risk on 12/05/2023 10:00:00 AM
From the BLS: Job Openings and Labor Turnover Summary
The number of job openings decreased to 8.7 million on the last business day of October, the U.S. Bureau of Labor Statistics reported today. Over the month, the number of hires and total separations changed little at 5.9 million and 5.6 million, respectively. Within separations, quits (3.6 million) and layoffs and discharges (1.6 million) changed little.The following graph shows job openings (black line), hires (dark blue), Layoff, Discharges and other (red column), and Quits (light blue column) from the JOLTS.
emphasis added
This series started in December 2000.
Note: The difference between JOLTS hires and separations is similar to the CES (payroll survey) net jobs headline numbers. This report is for October; the employment report this Friday will be for November.
 Click on graph for larger image.
Note that hires (dark blue) and total separations (red and light blue columns stacked) are usually pretty close each month. This is a measure of labor market turnover. When the blue line is above the two stacked columns, the economy is adding net jobs - when it is below the columns, the economy is losing jobs.
The spike in layoffs and discharges in March 2020 is labeled, but off the chart to better show the usual data.
Jobs openings decreased in October to 8.73 million from 9.35 million in September.
The number of job openings (black) were down 17% year-over-year.
Quits were down 10% year-over-year. These are voluntary separations. (See light blue columns at bottom of graph for trend for "quits").
CoreLogic: US Home Prices Increased 4.7% Year-over-year in October
by Calculated Risk on 12/05/2023 08:00:00 AM
Notes: This CoreLogic House Price Index report is for October. The recent Case-Shiller index release was for September. The CoreLogic HPI is a three-month weighted average and is not seasonally adjusted (NSA).
From CoreLogic: US Home Price Growth Continues Slow But Steady Increase in October, CoreLogic Reports
• U.S. single-family home prices increased by 4.7% year over year in September, the 141st straight month of annual appreciation.
• CoreLogic projects that annual home price growth will relax to 2.9% by October 2024.
• Northeastern states again led the country for annual appreciation in October, while four Western states saw slight losses.
...
U.S. single-family home price growth continued to increase modestly in October, posting a 4.7% year over-year increase. On a regional level, the Northeast again showed the biggest price rebound. The top five states with the highest annual appreciation in October are in that area of the country, with growth ranging from 10.3% in Connecticut to 9.3% in Maine and New Hampshire. The Northeast could be enjoying renewed home price gains in part due to a largely hybrid American workforce, in which employees need to be relatively close to major urban areas to allow for commutes to the office a few times per week.
“Home price growth maintained its upward momentum in October, which continues to reflect gains from the strong spring season and contrasts with last year's home price declines,” said Dr. Selma Hepp, chief economist for CoreLogic. “But even with high mortgage rates, October's price gains line up with historical trends and speak to the strength of some potential buyers’ purchasing power, as they continue to outnumber available homes for sale. Metros that are seeing relatively stronger price gains are those with higher job growth, as well as those with an influx of higher-income, in-migrating households.”
emphasis added
Monday, December 04, 2023
Tuesday: Job Openings, ISM Services
by Calculated Risk on 12/04/2023 07:06:00 PM
 From Matthew Graham at Mortgage News Daily: Mortgage Rates Move Slightly Higher, But Still Effectively at 3-Month Lows
Apart from this past Friday, you'd have to go back to September 1st to see lower mortgage rates than today. ... the incoming economic data has the potential to send rates significantly higher or lower. ... The first key report is CPI, the consumer price index, which serves as the most widely traded update on inflation. The last release was on November 14th and it sent rates quickly lower. [30 year fixed 7.11%]Tuesday:
emphasis added
• At 8:00 AM ET, Corelogic House Price index for October.
• At 10:00 AM, Job Openings and Labor Turnover Survey for October from the BLS.
• Also at 10:00 AM, the ISM Services Index for November. The consensus is for 52.5, up from 51.8.
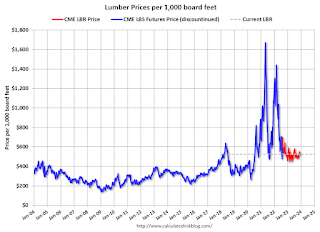
Update: Lumber Prices Up Slightly YoY
by Calculated Risk on 12/04/2023 01:42:00 PM
Here is another monthly update on lumber prices.
Unfortunately, this impacts long term price comparisons since the new contract was priced about 24% higher than the old random length contract for the period both contracts were available.
This graph shows CME random length framing futures through last August (blue), and the new physically-delivered Lumber Futures (LBR) contract starting in August 2022 (Red).
 Click on graph for larger image.
We didn't see a significant runup in prices this Spring due to the housing slowdown.
This graph shows CME random length framing futures through last August (blue), and the new physically-delivered Lumber Futures (LBR) contract starting in August 2022 (Red).
LBR is currently at $525.00 per 1000 board feet, up 2% from $515.00 a year ago.
 Click on graph for larger image.
There is somewhat of a seasonal demand for lumber, and lumber prices usually peak in April or May.
We didn't see a significant runup in prices this Spring due to the housing slowdown.
ICE (Black Knight) Mortgage Monitor: "Home prices continued sending mixed signals in October"
by Calculated Risk on 12/04/2023 10:12:00 AM
Today, in the Calculated Risk Real Estate Newsletter: IICE (Black Knight) Mortgage Monitor: "Home prices continued sending mixed signals in October"
A brief excerpt:
And on Florida inventory:There is much more in the article. You can subscribe at https://calculatedrisk.substack.com/
Florida has experienced some of the largest inventory gains in recent months
• In fact, six of the nine markets seeing the strongest inventory growth over the past three months – Palm Bay (+22pp), Lakeland (+21pp), Tampa (+19pp), Cape Coral (+18pp), North Port (+16pp) and Orlando (+14pp) – are located in the Sunshine State
• Inventory in Lakeland is now 15% above 2017-2019 averages, surpassing Austin for the largest surplus of homes for sale compared to prepandemic levels
• While Miami has also shown inventory improvements it continues to have the deepest inventory deficit in the state with 42% fewer homes for sale compared to 2017-2019 same-month averages, in line with the national average
• Florida will be worth watching in coming months to determine if rising inventory levels lead to softening prices
emphasis added

Housing December 4th Weekly Update: Inventory Down 1.8% Week-over-week, Up 1.0% Year-over-year
by Calculated Risk on 12/04/2023 08:16:00 AM
Altos reports that active single-family inventory was down 1.8% week-over-week and is now up 1.0% year-over-year. Inventory will decrease seasonally for next several weeks (for the Holidays).
 Click on graph for larger image.
This inventory graph is courtesy of Altos Research.
As of December 1st, inventory was at 556 thousand (7-day average), compared to 566 thousand the prior week.
Year-to-date, inventory is up 13.2%.

The red line is for 2023. The black line is for 2019. Note that inventory is up from the record low for the same week in 2021, but below last year and still well below normal levels.
Inventory was up 1.0% compared to the same week in 2022 (last week it was up 0.2%), and down 34.9% compared to the same week in 2019 (last week down 35.1%).
Inventory is now solidly above the same week in 2020 levels (dark blue line).
Mike Simonsen discusses this data regularly on Youtube.
Sunday, December 03, 2023
Sunday Night Futures
by Calculated Risk on 12/03/2023 11:40:00 PM
Weekend:
• Schedule for Week of December 3, 2023
Monday:
• No major economic releases scheduled.
From CNBC: Pre-Market Data and Bloomberg futures S&P 500 futures are down 7 and DOW futures are up 22 (fair value).
Oil prices were down over the last week with WTI futures at $74.07 per barrel and Brent at $78.88 per barrel. A year ago, WTI was at $80, and Brent was at $87 - so WTI oil prices were down 7% year-over-year.
Here is a graph from Gasbuddy.com for nationwide gasoline prices. Nationally prices are at $3.23 per gallon. A year ago, prices were at $3.37 per gallon, so gasoline prices are down $0.14 year-over-year.


