by Calculated Risk on 12/06/2023 07:28:00 PM
Wednesday, December 06, 2023
Thursday: Unemployment Claims, Q3 Flow of Funds

Thursday:
• At 8:30 AM ET, The initial weekly unemployment claims report will be released. The consensus is for 224 thousand, up from 218 thousand last week.
• 12:00 PM, Q3 Flow of Funds Accounts of the United States from the Federal Reserve.
Heavy Truck Sales Increased in November, up 5% YoY
by Calculated Risk on 12/06/2023 03:45:00 PM
This graph shows heavy truck sales since 1967 using data from the BEA. The dashed line is the November 2023 seasonally adjusted annual sales rate (SAAR).
Heavy truck sales really collapsed during the great recession, falling to a low of 180 thousand SAAR in May 2009. Then heavy truck sales increased to a new record high of 570 thousand SAAR in April 2019.
 Click on graph for larger image.
Note: "Heavy trucks - trucks more than 14,000 pounds gross vehicle weight."
Heavy truck sales declined sharply at the beginning of the pandemic, falling to a low of 308 thousand SAAR in May 2020.
As I noted last Friday, Vehicles Sales decrease to 15.32 million SAAR in November; Up 7% YoY
 The second graph shows light vehicle sales since the BEA started keeping data in 1967. Vehicle sales were at 15.32 million SAAR in November, down from 15.44 million in October, and up 6% from 14.27 million in November 2022.
1st Look at Local Housing Markets in November with Comparison to 2019
by Calculated Risk on 12/06/2023 01:31:00 PM
Today, in the Calculated Risk Real Estate Newsletter: 1st Look at Local Housing Markets in November with Comparison to 2019
A brief excerpt:
NOTE: The tables for active listings, new listings and closed sales all include a comparison to November 2019 for each local market (some 2019 data is not available).There is much more in the article. You can subscribe at https://calculatedrisk.substack.com/
This is the first look at several early reporting local markets in November. I’m tracking about 40 local housing markets in the US. Some of the 40 markets are states, and some are metropolitan areas. I’ll update these tables throughout the month as additional data is released.
Closed sales in November were mostly for contracts signed in September and October. Since 30-year fixed mortgage rates were in the 7.2% in September, and 7.6% in October, compared to the mid-6% range the previous year, closed sales were down year-over-year in November.
...
Here is a summary of active listings for these early reporting housing markets in November.
There are significant regional differences when comparing to 2019 levels. For example, inventory is up in San Diego compared to November 2019, and down sharply in Las Vegas.
Inventory for these markets were down 10.9% YoY in November and are now down 4.5% YoY.
...
This was just several early reporting markets. Many more local markets to come!
Trade Deficit increased to $64.3 Billion in October
by Calculated Risk on 12/06/2023 08:30:00 AM
The Census Bureau and the Bureau of Economic Analysis reported:
The U.S. Census Bureau and the U.S. Bureau of Economic Analysis announced today that the goods and services deficit was $64.3 billion in October, up $3.1 billion from $61.2 billion in September, revised
October exports were $258.8 billion, $2.6 billion less than September exports. October imports were $323.0 billion, $0.5 billion more than September imports.
emphasis added
 Click on graph for larger image.
Exports decreased and imports increased in October.
Exports are up 1% year-over-year; imports are down 3% year-over-year.
Both imports and exports decreased sharply due to COVID-19 and then bounced back - and imports had been decreasing and exports moving sideways recently.
The second graph shows the U.S. trade deficit, with and without petroleum.
 The blue line is the total deficit, and the black line is the petroleum deficit, and the red line is the trade deficit ex-petroleum products.
Note that net, exports of petroleum products are positive and have been increasing.
The trade deficit with China decreased to $25.5 billion from $28.8 billion a year ago.
ADP: Private Employment Increased 103,000 in November
by Calculated Risk on 12/06/2023 08:15:00 AM
Private sector employment increased by 103,000 jobs in November and annual pay was up 5.6 percent year-over-year, according to the November ADP® National Employment ReportTM produced by the ADP Research Institute® in collaboration with the Stanford Digital Economy Lab (“Stanford Lab”). T The ADP National Employment Report is an independent measure and high-frequency view of the private-sector labor market based on actual, anonymized payroll data of more than 25 million U.S. employees.This was below the consensus forecast of 120,000. The BLS report will be released Friday, and the consensus is for 200 thousand non-farm payroll jobs added in November.
...
“Restaurants and hotels were the biggest job creators during the post-pandemic recovery,” said Nela Richardson, chief economist, ADP. “But that boost is behind us, and the return to trend in leisure and hospitality suggests the economy as a whole will see more moderate hiring and wage growth in 2024.”
emphasis added
MBA: Mortgage Applications Increased in Weekly Survey
by Calculated Risk on 12/06/2023 07:00:00 AM
From the MBA: Mortgage Applications Increase in Latest MBA Weekly Survey
Mortgage applications increased 2.8 percent from one week earlier, according to data from the Mortgage Bankers Association’s (MBA) Weekly Mortgage Applications Survey for the week ending December 1, 2023. Last week’s results include an adjustment for the observance of the Thanksgiving holiday.
The Market Composite Index, a measure of mortgage loan application volume, increased 2.8 percent on a seasonally adjusted basis from one week earlier. On an unadjusted basis, the Index increased 43 percent compared with the previous week. The Refinance Index increased 14 percent from the previous week and was 10 percent higher than the same week one year ago. The seasonally adjusted Purchase Index decreased 0.3 percent from one week earlier. The unadjusted Purchase Index increased 35 percent compared with the previous week and was 17 percent lower than the same week one year ago.
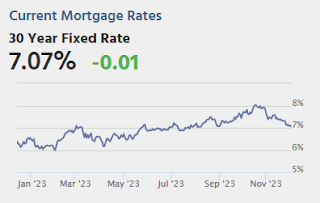
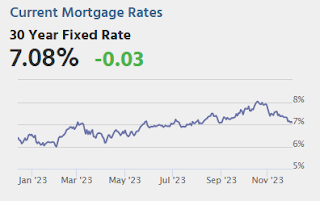
“Mortgage rates declined last week, with the 30-year fixed-rate mortgage falling to 7.17 percent – the lowest level since August 2023. Slower inflation and financial markets anticipating the potential end of the Fed’s hiking cycle are both behind the recent decline in rates,” said Joel Kan, MBA’s Vice President and Deputy Chief Economist. “Refinance applications saw the strongest week in two months and increased on a year-over-year basis for the second consecutive week for the first time since late 2021. The overall level of refinance applications is still very low, but recent increases could signal that 2023 was the low point in this cycle for refinance activity, consistent with our originations forecast. Purchase applications remained 17 percent lower than a year ago, held back by low inventory and still-challenging affordability conditions.”
...
The average contract interest rate for 30-year fixed-rate mortgages with conforming loan balances ($726,200 or less) decreased to 7.17 percent from 7.37 percent, with points decreasing to 0.60 from 0.64 (including the origination fee) for 80 percent loan-to-value ratio (LTV) loans.
emphasis added
 Click on graph for larger image.
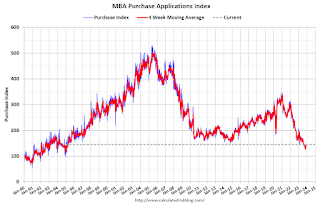
The first graph shows the MBA mortgage purchase index.
According to the MBA, purchase activity is down 17% year-over-year unadjusted.

Tuesday, December 05, 2023
Wednesday: ADP Employment, Trade Deficit
by Calculated Risk on 12/05/2023 07:05:00 PM

Wednesday:
• At 7:00 AM ET, The Mortgage Bankers Association (MBA) will release the results for the mortgage purchase applications index.
• At 8:15 AM, The ADP Employment Report for November. This report is for private payrolls only (no government). The consensus is for 120,000 jobs added, up from 113,000 in October.
• At 8:30 AM, Trade Balance report for October from the Census Bureau. The consensus is the trade deficit to be $63.0 billion. The U.S. trade deficit was at $61.5 billion in September.
ISM® Services Index Increases to 52.7% in November
by Calculated Risk on 12/05/2023 04:17:00 PM
(Posted with permission). The ISM® Services index was at 52.7%, up from 51.8% last month. The employment index increased to 50.7%, from 50.2%. Note: Above 50 indicates expansion, below 50 in contraction.
From the Institute for Supply Management: Services PMI® at 52.7% November 2023 Services ISM® Report On Business®
Economic activity in the services sector expanded in November for the 11th consecutive month as the Services PMI® registered 52.7 percent, say the nation's purchasing and supply executives in the latest Services ISM® Report On Business®. The sector has grown in 41 of the last 42 months, with the lone contraction in December 2022.The PMI was slightly above expectations.
The report was issued today by Anthony Nieves, CPSM, C.P.M., A.P.P., CFPM, Chair of the Institute for Supply Management® (ISM®) Services Business Survey Committee: “In November, the Services PMI® registered 52.7 percent, 0.9 percentage point higher than October’s reading of 51.8 percent. The composite index indicated growth in November for the 11th consecutive month after a reading of 49.2 percent in December 2022, which was the first contraction since May 2020 (45.4 percent). The Business Activity Index registered 55.1 percent; a 1-percentage point increase compared to the reading of 54.1 percent in October. The New Orders Index expanded in November for the 11th consecutive month after contracting in December for the first time since May 2020; the figure of 55.5 percent equals the October reading.
emphasis added
Asking Rents Down 1.1% Year-over-year
by Calculated Risk on 12/05/2023 12:27:00 PM
Today, in the Calculated Risk Real Estate Newsletter: Asking Rents Down 1.1% Year-over-year
A brief excerpt:
Here is a graph of the year-over-year (YoY) change for these measures since January 2015. Most of these measures are through October 2023, except CoreLogic is through September and Apartment List is through November 2023.There is much more in the article. You can subscribe at https://calculatedrisk.substack.com/
The CoreLogic measure is up 2.6% YoY in September, down from 2.9% in August, and down from a peak of 13.9% in April 2022.
The Zillow measure is up 3.2% YoY in October, mostly unchanged from 3.2% YoY in September, and down from a peak of 16.1% YoY in March 2022.
The ApartmentList measure is down 1.1% YoY as of November, up from -1.2% in October, and down from a peak of 18.2% YoY November 2021.
...
OER and CPI shelter will decline further in the CPI release next week.
BLS: Job Openings Decreased to 8.7 million in October
by Calculated Risk on 12/05/2023 10:00:00 AM
From the BLS: Job Openings and Labor Turnover Summary
The number of job openings decreased to 8.7 million on the last business day of October, the U.S. Bureau of Labor Statistics reported today. Over the month, the number of hires and total separations changed little at 5.9 million and 5.6 million, respectively. Within separations, quits (3.6 million) and layoffs and discharges (1.6 million) changed little.The following graph shows job openings (black line), hires (dark blue), Layoff, Discharges and other (red column), and Quits (light blue column) from the JOLTS.
emphasis added
This series started in December 2000.
Note: The difference between JOLTS hires and separations is similar to the CES (payroll survey) net jobs headline numbers. This report is for October; the employment report this Friday will be for November.
 Click on graph for larger image.
Note that hires (dark blue) and total separations (red and light blue columns stacked) are usually pretty close each month. This is a measure of labor market turnover. When the blue line is above the two stacked columns, the economy is adding net jobs - when it is below the columns, the economy is losing jobs.
The spike in layoffs and discharges in March 2020 is labeled, but off the chart to better show the usual data.
Jobs openings decreased in October to 8.73 million from 9.35 million in September.
The number of job openings (black) were down 17% year-over-year.
Quits were down 10% year-over-year. These are voluntary separations. (See light blue columns at bottom of graph for trend for "quits").


