by Calculated Risk on 12/08/2023 08:30:00 AM
Friday, December 08, 2023
November Employment Report: 199 thousand Jobs, 3.7% Unemployment Rate
From the BLS:
Total nonfarm payroll employment increased by 199,000 in November, and the unemployment rate edged down to 3.7 percent, the U.S. Bureau of Labor Statistics reported today. Job gains occurred in health care and government. Employment also increased in manufacturing, reflecting the return of workers from a strike. Employment in retail trade declined.
...
he change in total nonfarm payroll employment for September was revised down by 35,000, from +297,000 to +262,000, and the change for October remained at +150,000. With these revisions, employment in September and October combined is 35,000 lower than previously reported.
emphasis added
 Click on graph for larger image.
The first graph shows the jobs added per month since January 2021.
Payrolls for September and October were revised down 35 thousand, combined.
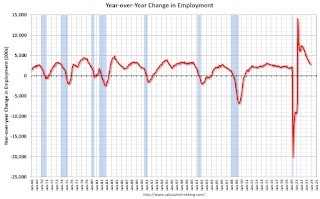 The second graph shows the year-over-year change in total non-farm employment since 1968.
In November, the year-over-year change was 2.79 million jobs. Employment was up solidly year-over-year but has slowed to more normal levels of job growth recently.
The third graph shows the employment population ratio and the participation rate.
 The Labor Force Participation Rate increased to 62.8% in November, from 62.7% in October. This is the percentage of the working age population in the labor force.
 The Employment-Population ratio increased to 60.5% from 60.2% (blue line).
I'll post the 25 to 54 age group employment-population ratio graph later.
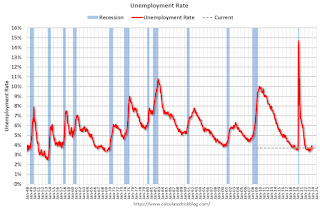 The fourth graph shows the unemployment rate.
 The unemployment rate decreased to 3.7% in November from 3.9% in October.
This was at consensus expectations, however, September and October payrolls were revised down by 35,000 combined.
Thursday, December 07, 2023
Friday: Employment Report
by Calculated Risk on 12/07/2023 07:24:00 PM

Friday:
• At 8:30 AM ET, Employment Report for November. The consensus is for 200,000 jobs added, and for the unemployment rate to be unchanged at 3.9%.
• At 10:00 AM, University of Michigan's Consumer sentiment index (Preliminary for December).
November Employment Preview
by Calculated Risk on 12/07/2023 03:02:00 PM
On Friday at 8:30 AM ET, the BLS will release the employment report for November. The consensus is for 200,000 jobs added, and for the unemployment rate to be unchanged at 3.9%.
From BofA economists:
"Nonfarm payroll employment likely rose by 200k in November following a 150k increase in October. The main factor behind the acceleration relative to September is that two major strikes ended ahead of the November survey period. ... On the household survey, we expect the labor force participation rate to be unchanged at 62.7% as we believe cyclical gains to participation rate are diminishing. Given this and our expectation for fairly strong employment growth, we forecast the unemployment rate to be unchanged at 3.9%, though there is a risk that it rounds down to 3.8%."From Goldman Sachs:
"We estimate nonfarm payrolls rose by 238k in November, above consensus ... Alternative measures of employment growth indicate another month of robust job growth on average, government hiring likely remained strong, and layoffs remain low. ... We estimate that the unemployment rate declined to 3.8%."• ADP Report: The ADP employment report showed 103,000 private sector jobs were added in November. This suggests job gains below consensus expectations, however, in general, ADP hasn't been very useful in forecasting the BLS report.
• ISM Surveys: Note that the ISM services are diffusion indexes based on the number of firms hiring (not the number of hires). The ISM® manufacturing employment index decreased in November to 45.8%, down from 46.8% last month. This would suggest about 40,000 job lost in manufacturing. The ADP report indicated 15,000 manufacturing jobs lost in November.
The ISM® services employment index increased to 50.7%, from 50.2%. This would suggest about 95,000 jobs added in the service sector. Combined this suggests job gains of 50,000 in November, below consensus expectations.
• Unemployment Claims: The weekly claims report showed a larger number of initial unemployment claims during the reference week (the 5th through the 11th in November) from 200,000 in October to 235,000 in November. This suggests more layoffs in November compared to October.
The "Home ATM" Mostly Closed in Q3
by Calculated Risk on 12/07/2023 01:05:00 PM
Today, in the Real Estate Newsletter: The "Home ATM" Mostly Closed in Q3
Excerpt:
During the housing bubble, many homeowners borrowed heavily against their perceived home equity - jokingly calling it the “Home ATM” - and this contributed to the subsequent housing bust, since so many homeowners had negative equity in their homes when house prices declined. Note: Very few homeowners have negative equity now - unlike during the housing bubble.There is much more in the article. You can subscribe at https://calculatedrisk.substack.com/.
...
Here is the quarterly increase in mortgage debt from the Federal Reserve’s Financial Accounts of the United States - Z.1 (sometimes called the Flow of Funds report) released today. In the mid ‘00s, there was a large increase in mortgage debt associated with the housing bubble.
In Q3 2023, mortgage debt increased $85 billion, down from $92 billion in Q2, and down from the cycle peak of $467 billion in Q2 2021. Note the almost 7 years of declining mortgage debt as distressed sales (foreclosures and short sales) wiped out a significant amount of debt.
However, some of this debt is being used to increase the housing stock (purchase new homes), so this isn’t all Mortgage Equity Withdrawal (MEW).
Fed's Flow of Funds: Household Net Worth Decreased $1.3 Trillion in Q3
by Calculated Risk on 12/07/2023 12:23:00 PM
The Federal Reserve released the Q3 2023 Flow of Funds report today: Financial Accounts of the United States.
The net worth of households and nonprofits fell to $151.0 trillion during the third quarter of 2023. The value of directly and indirectly held corporate equities decreased $1.7 trillion and the value of real estate increased $0.5 trillion.
...
Household debt increased 2.5 percent at an annual rate in the third quarter of 2023. Consumer credit grew at an annual rate of 1.1 percent, while mortgage debt (excluding charge-offs) grew at an annual rate of 2.5 percent.
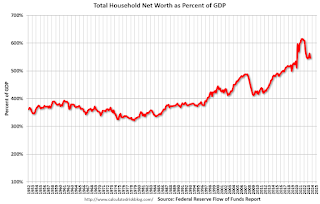 Click on graph for larger image.
The first graph shows Households and Nonprofit net worth as a percent of GDP.
 The second graph shows homeowner percent equity since 1952.
 Household percent equity (as measured by the Fed) collapsed when house prices fell sharply in 2007 and 2008.
In Q3 2023, household percent equity (of household real estate) was at 74.2% - up from 73.1% in Q2, 2023. This is close to the highest percent equity since the 1960s.
Note: This includes households with no mortgage debt.
 The third graph shows household real estate assets and mortgage debt as a percent of GDP.
 Mortgage debt increased by $85 billion in Q3.
Mortgage debt is up $2.23 trillion from the peak during the housing bubble, but, as a percent of GDP is at 46.8% - down from Q2 - and down from a peak of 73.3% of GDP during the housing bust.
The value of real estate, as a percent of GDP, decreased in Q3 - but is below the peak in Q3 2022 - but is well above the average of the last 30 years.
Wholesale Used Car Prices Decreased 2.1% in November; Down 5.8% Year-over-year
by Calculated Risk on 12/07/2023 11:25:00 AM
From Manheim Consulting today: Wholesale Used-Vehicle Prices Decrease in November
Wholesale used-vehicle prices (on a mix, mileage, and seasonally adjusted basis) decreased 2.1% in November from October. The Manheim Used Vehicle Value Index (MUVVI) dropped to 205.0, down 5.8% from a year ago.
“While November’s decline was only slightly less than October’s, the move lower was on our radar, given the typical seasonal downward trend that paused in August and September,” said Chris Frey, senior manager of Economic and Industry Insights for Cox Automotive. “Prices still have a chance of rising slightly in December, though we’re not predicting an odd spike or trough. Rather, we’re expecting a measured movement through the end of the month and the year, which should get us close to the January forecast for a 4% year-over-year decline by December 2023. We’ll share our 2024 forecast during our January 8 call, but current views suggest less of a roller coaster in the new year.”
The seasonal adjustment reduced the November decrease. The non-adjusted price in November declined by 2.9% compared to October, moving the unadjusted average price down 7.5% year over year.
emphasis added
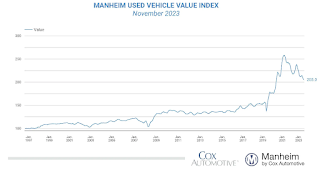 Click on graph for larger image.
This index from Manheim Consulting is based on all completed sales transactions at Manheim’s U.S. auctions.
Weekly Initial Unemployment Claims Increase to 220,000
by Calculated Risk on 12/07/2023 08:30:00 AM
The DOL reported:
In the week ending December 2, the advance figure for seasonally adjusted initial claims was 220,000, an increase of 1,000 from the previous week's revised level. The previous week's level was revised up by 1,000 from 218,000 to 219,000. The 4-week moving average was 220,750, an increase of 500 from the previous week's revised average. The previous week's average was revised up by 250 from 220,000 to 220,250.The following graph shows the 4-week moving average of weekly claims since 1971.
emphasis added
 Click on graph for larger image.
The dashed line on the graph is the current 4-week average. The four-week average of weekly unemployment claims increased to 220,750.
The previous week was revised up.
Weekly claims were slightly below the consensus forecast.
Wednesday, December 06, 2023
Thursday: Unemployment Claims, Q3 Flow of Funds
by Calculated Risk on 12/06/2023 07:28:00 PM
Thursday:
• At 8:30 AM ET, The initial weekly unemployment claims report will be released. The consensus is for 224 thousand, up from 218 thousand last week.
• 12:00 PM, Q3 Flow of Funds Accounts of the United States from the Federal Reserve.
Heavy Truck Sales Increased in November, up 5% YoY
by Calculated Risk on 12/06/2023 03:45:00 PM
This graph shows heavy truck sales since 1967 using data from the BEA. The dashed line is the November 2023 seasonally adjusted annual sales rate (SAAR).
Heavy truck sales really collapsed during the great recession, falling to a low of 180 thousand SAAR in May 2009. Then heavy truck sales increased to a new record high of 570 thousand SAAR in April 2019.
 Click on graph for larger image.
Note: "Heavy trucks - trucks more than 14,000 pounds gross vehicle weight."
Heavy truck sales declined sharply at the beginning of the pandemic, falling to a low of 308 thousand SAAR in May 2020.
As I noted last Friday, Vehicles Sales decrease to 15.32 million SAAR in November; Up 7% YoY
 The second graph shows light vehicle sales since the BEA started keeping data in 1967. Vehicle sales were at 15.32 million SAAR in November, down from 15.44 million in October, and up 6% from 14.27 million in November 2022.
1st Look at Local Housing Markets in November with Comparison to 2019
by Calculated Risk on 12/06/2023 01:31:00 PM
Today, in the Calculated Risk Real Estate Newsletter: 1st Look at Local Housing Markets in November with Comparison to 2019
A brief excerpt:
NOTE: The tables for active listings, new listings and closed sales all include a comparison to November 2019 for each local market (some 2019 data is not available).There is much more in the article. You can subscribe at https://calculatedrisk.substack.com/
This is the first look at several early reporting local markets in November. I’m tracking about 40 local housing markets in the US. Some of the 40 markets are states, and some are metropolitan areas. I’ll update these tables throughout the month as additional data is released.
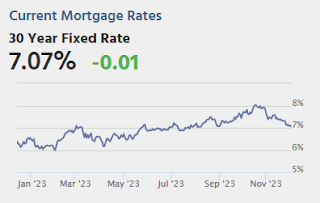
Closed sales in November were mostly for contracts signed in September and October. Since 30-year fixed mortgage rates were in the 7.2% in September, and 7.6% in October, compared to the mid-6% range the previous year, closed sales were down year-over-year in November.
...
Here is a summary of active listings for these early reporting housing markets in November.
There are significant regional differences when comparing to 2019 levels. For example, inventory is up in San Diego compared to November 2019, and down sharply in Las Vegas.
Inventory for these markets were down 10.9% YoY in November and are now down 4.5% YoY.
...
This was just several early reporting markets. Many more local markets to come!


