 RSS Feed
 by Calculated Risk on 12/09/2023 02:11:00 PM
Saturday, December 09, 2023
Real Estate Newsletter Articles this Week: The "Home ATM" Mostly Closed in Q3
At the Calculated Risk Real Estate Newsletter this week:
• The "Home ATM" Mostly Closed in Q3
• Q3 Update: Delinquencies, Foreclosures and REO
• 1st Look at Local Housing Markets in November with Comparison to 2019
• Asking Rents Down 1.1% Year-over-year
• ICE (Black Knight) Mortgage Monitor: "Home prices continued sending mixed signals in October"
This is usually published 4 to 6 times a week and provides more in-depth analysis of the housing market.
You can subscribe at https://calculatedrisk.substack.com/
Schedule for Week of December 10, 2023
by Calculated Risk on 12/09/2023 08:11:00 AM
The key economic reports this week are November CPI and Retail Sales.
For manufacturing, November Industrial Production, and the December New York Fed survey will be released this week.
The FOMC meets this week and no change to policy is expected.
No major economic releases scheduled.
6:00 AM: NFIB Small Business Optimism Index for November.
8:30 AM: The Consumer Price Index for November from the BLS. The consensus is for no change in CPI, and a 0.3% increase in core CPI. The consensus is for CPI to be up 3.1% year-over-year and core CPI to be up 4.0% YoY.
7:00 AM ET: The Mortgage Bankers Association (MBA) will release the results for the mortgage purchase applications index.
8:30 AM: The Producer Price Index for November from the BLS. The consensus is for a 0.1% increase in PPI, and a 0.2% increase in core PPI.
2:00 PM: FOMC Meeting Announcement. No change to policy is expected at this meeting.
2:00 PM: FOMC Forecasts This will include the Federal Open Market Committee (FOMC) participants' projections of the appropriate target federal funds rate along with the quarterly economic projections.
2:30 PM: Fed Chair Jerome Powell holds a press briefing following the FOMC announcement.
 8:30 AM ET: Retail sales for November will be released. The consensus is for a 0.1% decrease in retail sales.
This graph shows retail sales since 1992. This is monthly retail sales and food service, seasonally adjusted (total and ex-gasoline).
8:30 AM: The initial weekly unemployment claims report will be released. The consensus is for 220 thousand, unchanged from 220 thousand last week.
8:30 AM: The New York Fed Empire State manufacturing survey for December. The consensus is for a reading of 3.5, down from 9.1.
 9:15 AM: The Fed will release Industrial Production and Capacity Utilization for November.
This graph shows industrial production since 1967.
The consensus is for a 0.2% increase in Industrial Production, and for Capacity Utilization to increase to 79.1%.
Friday, December 08, 2023
Dec 8th COVID Update: Hospitalizations Increased
by Calculated Risk on 12/08/2023 07:23:00 PM
 Note: Mortgage rates are from MortgageNewsDaily.com and are for top tier scenarios.
Due to changes at the CDC, weekly cases are no longer updated.
For deaths, I'm currently using 3 weeks ago for "now", since the most recent two weeks will be revised significantly.
Hospitalizations have more almost tripled from a low of 5,150 in June 2023.
Hospitalizations are far below the peak of 150,000 in January 2022.
| COVID Metrics | ||||
|---|---|---|---|---|
| Now | Week Ago | Goal | ||
| Hospitalized2🚩 | 17,479 | 15,516 | ≤3,0001 | |
| Deaths per Week2 | 1,197 | 1,291 | ≤3501 | |
| 1my goals to stop weekly posts, 2Weekly for Currently Hospitalized, and Deaths 🚩 Increasing number weekly for Hospitalized and Deaths ✅ Goal met. | ||||
 Click on graph for larger image.
This graph shows the weekly (columns) number of deaths reported.
Weekly deaths have more than doubled from a low of 485 in early July. Weekly deaths are far below the weekly peak of 26,000 in January 2021.
And here is a new graph I'm following on COVID in wastewater:
 Note the recent surge in COVID.
This appears to be a leading indicator for COVID hospitalizations and deaths, and both will likely increase over the next several weeks.
AAR: November Carloads Down Slightly YoY; Intermodal Up
by Calculated Risk on 12/08/2023 04:30:00 PM
From the Association of American Railroads (AAR) Rail Time Indicators. Graphs and excerpts reprinted with permission.
In the first 11 months of 2023, total carloads were 10.82 million, up 0.2% (21,700 carloads) over last year and up 0.5% (53,682 carloads) over 2021. ... In 2023 through November, intermodal originations totaled 11.68 million, down 6.0% (748,046 units) from 2022 and down 10.6% (1.39 million units) from 2021.
emphasis added
 Click on graph for larger image.
This graph from the Rail Time Indicators report shows the six-week average of U.S. Carloads in 2021, 2022 and 2023:
Total originated carloads on U.S. railroads fell 0.01%, or 102 carloads, in November 2023 from the equivalent period in 2022. It was the fifth year-over-year decline for total carloads in the past six months, but most of those declines have been very small in percentage terms. Total carloads averaged 225,715 per week in November 2023, the fourth lowest of the 11 months so far this year. The Thanksgiving holiday typically holds down rail volumes in November.
 The second graph shows the six-week average (not monthly) of U.S. intermodal in 2021, 2022 and 2023: (using intermodal or shipping containers):
U.S. intermodal volume was up 5.0% in November 2023, its third straight year-over-year gain after 18 straight declines and the biggest year-over-year percentage gain for intermodal in 29 months. U.S. railroads averaged 255,981 originated containers and trailers per week in November 2023. That’s the fourth highest average intermodal volume for November on record (2017, 2018, and 2020 were higher).
Q4 GDP Tracking: Close to 1%
by Calculated Risk on 12/08/2023 02:00:00 PM
From BofA:
Our 4Q GDP tracking estimate remains at 1.0% q/q saar as higher than expected October construction spending was offset by lower than expected vehicle sales in November and a small downward revision in core capital goods orders in the final October print. [Dec 6th estimate]From Goldman:
emphasis added
We lowered our Q4 GDP tracking estimate by 0.1pp to +1.4% (qoq ar). Our Q4 domestic final sales estimate remains at +2.1% (qoq ar). [Dec 7th estimate]And from the Altanta Fed: GDPNow
The GDPNow model estimate for real GDP growth (seasonally adjusted annual rate) in the fourth quarter of 2023 is 1.2 percent on December 7, down from 1.3 percent on December 6 after rounding. [Dec th estimate]
Q3 Update: Delinquencies, Foreclosures and REO
by Calculated Risk on 12/08/2023 12:17:00 PM
Today, in the Calculated Risk Real Estate Newsletter: Q3 Update: Delinquencies, Foreclosures and REO
A brief excerpt:
In 2021, I pointed out that with the end of the foreclosure moratoriums, combined with the expiration of a large number of forbearance plans, we would see an increase in REOs in late 2022 and into 2023. And there was a slight increase.There is much more in the article. You can subscribe at https://calculatedrisk.substack.com/
However, I argued this would NOT lead to a surge in foreclosures and significantly impact house prices (as happened following the housing bubble) since lending has been solid and most homeowners have substantial equity in their homes.
...
Here is some data from the FHFA’s National Mortgage Database showing the distribution of interest rates on closed-end, fixed-rate 1-4 family mortgages outstanding at the end of each quarter since Q1 2013 through Q2 2023 (Q3 2023 data will be released in a few weeks).
This shows the surge in the percent of loans under 3%, and also under 4%, starting in early 2020 as mortgage rates declined sharply during the pandemic. Currently 22.9% of loans are under 3%, 60.3% are under 4%, and 79.9% are under 5%.
With substantial equity, and low mortgage rates (mostly at a fixed rates), few homeowners will have financial difficulties.

Comments on November Employment Report
by Calculated Risk on 12/08/2023 09:27:00 AM
The headline jobs number in the November employment report was at expectations, however employment for the previous two months was revised down by 35,000, combined. The participation rate and the employment population ratio both increased, and the unemployment rate decreased to 3.7%.
Leisure and hospitality gained 40 thousand jobs in November. At the beginning of the pandemic, in March and April of 2020, leisure and hospitality lost 8.2 million jobs, and are now down 158 thousand jobs since February 2020. So, leisure and hospitality has now added back about 98% all of the jobs lost in March and April 2020.
Construction employment increased 2 thousand and is now 425 thousand above the pre-pandemic level.
Manufacturing employment increased 28 thousand jobs and is now 200 thousand above the pre-pandemic level.
In October, the year-over-year employment change was 2.79 million jobs.
Seasonal Retail Hiring
Typically, retail companies start hiring for the holiday season in October, and really increase hiring in November. Here is a graph that shows the historical net retail jobs added for October, November and December by year.
 This graph really shows the collapse in retail hiring in 2008. Since then, seasonal hiring had increased back close to more normal levels. Note: I expect the long-term trend will be down with more and more internet holiday shopping.
Retailers hired 264 thousand workers Not Seasonally Adjusted (NSA) net in November. This was about the same as last year and suggests similar real retail sales this holiday season as last year.
This was seasonally adjusted (SA) to a loss of 38 thousand jobs in November.
Prime (25 to 54 Years Old) Participation
 Since the overall participation rate is impacted by both cyclical (recession) and demographic (aging population, younger people staying in school) reasons, here is the employment-population ratio for the key working age group: 25 to 54 years old.
The 25 to 54 participation rate was unchanged in November at 83.3% from 83.3% in October, and the 25 to 54 employment population ratio declined to 80.7% from 80.6% the previous month.
Both are close to the pre-pandemic levels.
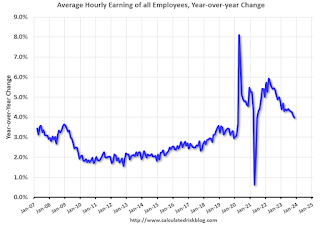
Average Hourly Wages
 The graph shows the nominal year-over-year change in "Average Hourly Earnings" for all private employees from the Current Employment Statistics (CES).
Average Hourly Wages
 The graph shows the nominal year-over-year change in "Average Hourly Earnings" for all private employees from the Current Employment Statistics (CES).
 There was a huge increase at the beginning of the pandemic as lower paid employees were let go, and then the pandemic related spike reversed a year later.
Wage growth has trended down after peaking at 5.9% YoY in March 2022 and was at 4.0% YoY in November.
Wage growth has trended down after peaking at 5.9% YoY in March 2022 and was at 4.0% YoY in November.
Since wages increased sharply last December, it is likely YoY wage growth will slow further next month.
Part Time for Economic Reasons
 From the BLS report:
"The number of persons employed part time for economic reasons decreased by 295,000 to 4.0 million in November. These individuals, who would have preferred full-time employment, were working part time because their hours had been reduced or they were unable to find full-time jobs."The number of persons working part time for economic reasons decreased in November to 3.99 million from 4.28 million in October. This is below pre-recession levels.
These workers are included in the alternate measure of labor underutilization (U-6) that decreased to 7.0% from 7.2% in the previous month. This is down from the record high in April 2020 of 22.9% and up from the lowest level on record (seasonally adjusted) in December 2022 (6.5%). (This series started in 1994). This measure is at the 7.0% level in February 2020 (pre-pandemic).
Unemployed over 26 Weeks
 This graph shows the number of workers unemployed for 27 weeks or more.
 According to the BLS, there are 1.150 million workers who have been unemployed for more than 26 weeks and still want a job, down from 1.282 million the previous month.
This is at pre-pandemic levels.
Job Streak
Through November 2023, the employment report indicated positive job growth for 35 consecutive months, putting the current streak in 5th place of the longest job streaks in US history (since 1939).
| Headline Jobs, Top 10 Streaks | ||
|---|---|---|
| Year Ended | Streak, Months | |
| 1 | 2019 | 100 |
| 2 | 1990 | 48 |
| 3 | 2007 | 46 |
| 4 | 1979 | 45 |
| 5 | 20231 | 35 |
| 6 tie | 1943 | 33 |
| 6 tie | 1986 | 33 |
| 6 tie | 2000 | 33 |
| 9 | 1967 | 29 |
| 10 | 1995 | 25 |
| 1Currrent Streak | ||
Summary:
The headline monthly jobs number was at consensus expectations; however, employment for the previous two months was revised down by 35,000, combined. The participation rate and the employment population ratio both increased, and the unemployment rate decreased to 3.7%.
Another solid employment report.
November Employment Report: 199 thousand Jobs, 3.7% Unemployment Rate
by Calculated Risk on 12/08/2023 08:30:00 AM
From the BLS:
Total nonfarm payroll employment increased by 199,000 in November, and the unemployment rate edged down to 3.7 percent, the U.S. Bureau of Labor Statistics reported today. Job gains occurred in health care and government. Employment also increased in manufacturing, reflecting the return of workers from a strike. Employment in retail trade declined.
...
he change in total nonfarm payroll employment for September was revised down by 35,000, from +297,000 to +262,000, and the change for October remained at +150,000. With these revisions, employment in September and October combined is 35,000 lower than previously reported.
emphasis added
 Click on graph for larger image.
The first graph shows the jobs added per month since January 2021.
Total payrolls increased by 199 thousand in November. Private payrolls increased by 150 thousand, and public payrolls increased 49 thousand.
Payrolls for September and October were revised down 35 thousand, combined.
Payrolls for September and October were revised down 35 thousand, combined.
 The second graph shows the year-over-year change in total non-farm employment since 1968.
In November, the year-over-year change was 2.79 million jobs. Employment was up solidly year-over-year but has slowed to more normal levels of job growth recently.
The third graph shows the employment population ratio and the participation rate.
 The Labor Force Participation Rate increased to 62.8% in November, from 62.7% in October. This is the percentage of the working age population in the labor force.
 The Employment-Population ratio increased to 60.5% from 60.2% (blue line).
I'll post the 25 to 54 age group employment-population ratio graph later.
 The fourth graph shows the unemployment rate.
 The unemployment rate decreased to 3.7% in November from 3.9% in October.
This was at consensus expectations, however, September and October payrolls were revised down by 35,000 combined.
Thursday, December 07, 2023
Friday: Employment Report
by Calculated Risk on 12/07/2023 07:24:00 PM
 Note: Mortgage rates are from MortgageNewsDaily.com and are for top tier scenarios.
Friday:
• At 8:30 AM ET, Employment Report for November. The consensus is for 200,000 jobs added, and for the unemployment rate to be unchanged at 3.9%.
• At 10:00 AM, University of Michigan's Consumer sentiment index (Preliminary for December).
November Employment Preview
by Calculated Risk on 12/07/2023 03:02:00 PM
On Friday at 8:30 AM ET, the BLS will release the employment report for November. The consensus is for 200,000 jobs added, and for the unemployment rate to be unchanged at 3.9%.
There were 150,000 jobs added in October, and the unemployment rate was at 3.9%.
From BofA economists:
"Nonfarm payroll employment likely rose by 200k in November following a 150k increase in October. The main factor behind the acceleration relative to September is that two major strikes ended ahead of the November survey period. ... On the household survey, we expect the labor force participation rate to be unchanged at 62.7% as we believe cyclical gains to participation rate are diminishing. Given this and our expectation for fairly strong employment growth, we forecast the unemployment rate to be unchanged at 3.9%, though there is a risk that it rounds down to 3.8%."From Goldman Sachs:
"We estimate nonfarm payrolls rose by 238k in November, above consensus ... Alternative measures of employment growth indicate another month of robust job growth on average, government hiring likely remained strong, and layoffs remain low. ... We estimate that the unemployment rate declined to 3.8%."• ADP Report: The ADP employment report showed 103,000 private sector jobs were added in November. This suggests job gains below consensus expectations, however, in general, ADP hasn't been very useful in forecasting the BLS report.
• ISM Surveys: Note that the ISM services are diffusion indexes based on the number of firms hiring (not the number of hires). The ISM® manufacturing employment index decreased in November to 45.8%, down from 46.8% last month. This would suggest about 40,000 job lost in manufacturing. The ADP report indicated 15,000 manufacturing jobs lost in November.
The ISM® services employment index increased to 50.7%, from 50.2%. This would suggest about 95,000 jobs added in the service sector. Combined this suggests job gains of 50,000 in November, below consensus expectations.
• Unemployment Claims: The weekly claims report showed a larger number of initial unemployment claims during the reference week (the 5th through the 11th in November) from 200,000 in October to 235,000 in November. This suggests more layoffs in November compared to October.
• COVID: As far as the pandemic, the number of patients hospitalized during the reference week in November was around 13,000, down from 14,000 in October.
• Conclusion: Most of the key indicators suggest a weaker employment report in November than in October. However, the end of the strikes will boost employment, but this is probably included in the consensus estimate. My guess is the headline number will be below the consensus.


