 RSS Feed
 by Calculated Risk on 12/12/2023 11:50:00 AM
Tuesday, December 12, 2023
Part 1: Current State of the Housing Market; Overview for mid-December
Today, in the Calculated Risk Real Estate Newsletter: Part 1: Current State of the Housing Market; Overview for mid-December
A brief excerpt:
Here is a graph of new listing from Realtor.com’s November 2023 Monthly Housing Market Trends Report showing new listings were up 7.5% year-over-year in October. New listings are now up year-over-year mostly because new listings collapsed in the 2nd half of 2022. From Realtor.com:There is much more in the article. You can subscribe at https://calculatedrisk.substack.com/
Providing a boost to overall inventory, sellers turned out in higher numbers this November as newly listed homes were 7.5% above last year’s levels. This marked the end to a 17-month streak of declining listing activity.For the local markets I track that have reported so far, are also showing new listings up year-over-year in November.

Cleveland Fed: Median CPI increased 0.4% and Trimmed-mean CPI increased 0.3% in November
by Calculated Risk on 12/12/2023 11:00:00 AM
The Cleveland Fed released the median CPI and the trimmed-mean CPI.
According to the Federal Reserve Bank of Cleveland, the median Consumer Price Index rose 0.4% in November. The 16% trimmed-mean Consumer Price Index increased 0.3% in November. "The median CPI and 16% trimmed-mean CPI are measures of core inflation calculated by the Federal Reserve Bank of Cleveland based on data released in the Bureau of Labor Statistics’ (BLS) monthly CPI report".
 Click on graph for larger image.
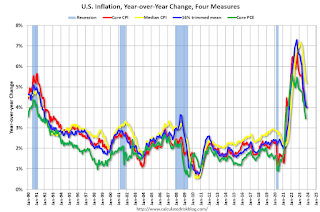
This graph shows the year-over-year change for these four key measures of inflation.
Note: The Cleveland Fed released the median CPI details. "Motor fuel" decreased at a 52% annualized rate in November. Rent and Owner's equivalent rent are still high, but decreasing.
According to the Federal Reserve Bank of Cleveland, the median Consumer Price Index rose 0.4% in November. The 16% trimmed-mean Consumer Price Index increased 0.3% in November. "The median CPI and 16% trimmed-mean CPI are measures of core inflation calculated by the Federal Reserve Bank of Cleveland based on data released in the Bureau of Labor Statistics’ (BLS) monthly CPI report".
 Click on graph for larger image.
This graph shows the year-over-year change for these four key measures of inflation.
On a year-over-year basis, the median CPI rose 5.2% (down from 5.3% in October), the trimmed-mean CPI rose 4.0% (down from 4.1%), and the CPI less food and energy rose 4.0% (unchanged from 4.0%).
Core PCE is for October was up 3.5% YoY, down from 3.7% in September.
Note: The Cleveland Fed released the median CPI details. "Motor fuel" decreased at a 52% annualized rate in November. Rent and Owner's equivalent rent are still high, but decreasing.
YoY Measures of Inflation: Services, Goods and Shelter
by Calculated Risk on 12/12/2023 09:21:00 AM
Here are a few measures of inflation:
The first graph is the one Fed Chair Powell had mentioned earlier when services less rent of shelter was up 7.6% year-over-year. This declined sharply and is now up 3.5% YoY.
 Click on graph for larger image.
This graph shows the YoY price change for Services and Services less rent of shelter through November 2023.
Services were up 5.2% YoY as of November 2023, up from 5.1% YoY in October.
Services less rent of shelter was up 3.5% YoY in November, up from 3.0% YoY in October.
Services less rent of shelter was up 3.5% YoY in November, up from 3.0% YoY in October.
 The second graph shows that goods prices started to increase year-over-year (YoY) in 2020 and accelerated in 2021 due to both strong demand and supply chain disruptions.
Durables were at -1.6% YoY as of November 2023, up from -2.1% YoY in October.
Commodities less food and energy commodities were unchanged YoY in November, unchanged from 0.0% YoY in October.
Commodities less food and energy commodities were unchanged YoY in November, unchanged from 0.0% YoY in October.
Goods inflation was transitory.
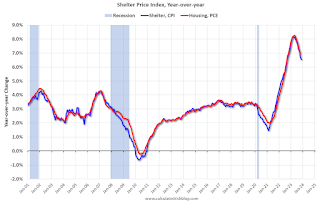 Here is a graph of the year-over-year change in shelter from the CPI report (through November) and housing from the PCE report (through October 2023)
Shelter was up 6.5% year-over-year in November, down from 6.7% in October. Housing (PCE) was up 6.9% YoY in October, down from 7.2% in September.
The BLS noted this morning: "The index for shelter continued to rise in November"
Core CPI ex-shelter was up 2.1% YoY in November, up from 2.0% in October.
BLS: CPI Increased 0.1% in November; Core CPI increased 0.3%
by Calculated Risk on 12/12/2023 08:30:00 AM
The Consumer Price Index for All Urban Consumers (CPI-U) increased 0.1 percent in November on a seasonally adjusted basis, after being unchanged in October, the U.S. Bureau of Labor Statistics reported today. Over the last 12 months, the all items index increased 3.1 percent before seasonal adjustment.The YoY change in CPI and core CPI were at expectations, although the MoM change was slightly higher than expected. I'll post a graph later today after the Cleveland Fed releases the median and trimmed-mean CPI.
The index for shelter continued to rise in November, offsetting a decline in the gasoline index. The energy index fell 2.3 percent over the month as a 6.0-percent decline in the gasoline index more than offset increases in other energy component indexes. The food index increased 0.2 percent in November, after rising 0.3 percent in October. The index for food at home increased 0.1 percent over the month and the index for food away from home rose 0.4 percent.
The index for all items less food and energy rose 0.3 percent in November, after rising 0.2 percent in October. Indexes which increased in November include rent, owners' equivalent rent, medical care, and motor vehicle insurance. The indexes for apparel, household furnishings and operations, communication, and recreation were among those that decreased over the month.
The all items index rose 3.1 percent for the 12 months ending November, a smaller increase than the 3.2-percent increase for the 12 months ending October. The all items less food and energy index rose 4.0 percent over the last 12 months, as it did for the 12 months ending October. The energy index decreased 5.4 percent for the 12 months ending November, while the food index increased 2.9 percent over the last year.
emphasis added
Monday, December 11, 2023
Tuesday: CPI
by Calculated Risk on 12/11/2023 07:01:00 PM
 From Matthew Graham at Mortgage News Daily: Mortgage Rates Barely Budge, But Volatility Potential is Much Higher Tomorrow
Jobs aside, inflation is the biggest nemesis for bonds/rates and the Consumer Price Index (CPI) is the biggest monthly revelation on the state of inflation. That's precisely why tomorrow's volatility potential is higher. The latest CPI will be released at 8:30am. If it's higher than forecast, rates should rise. If it's lower, rates should fall. If it comes in very far from forecasts, the movement could be quite abrupt. [30 year fixed 7.10%]Tuesday:
emphasis added
• At 6:00 AM ET, NFIB Small Business Optimism Index for November.
• At 8:30 AM, The Consumer Price Index for November from the BLS. The consensus is for no change in CPI, and a 0.3% increase in core CPI. The consensus is for CPI to be up 3.1% year-over-year and core CPI to be up 4.0% YoY.
2nd Look at Local Housing Markets in November with Comparison to 2019
by Calculated Risk on 12/11/2023 12:47:00 PM
Today, in the Calculated Risk Real Estate Newsletter: 2nd Look at Local Housing Markets in November with Comparison to 2019
A brief excerpt:
NOTE: The tables for active listings, new listings and closed sales all include a comparison to November 2019 for each local market (some 2019 data is not available).There is much more in the article. You can subscribe at https://calculatedrisk.substack.com/
This is the second look at several early reporting local markets in November. I’m tracking about 40 local housing markets in the US. Some of the 40 markets are states, and some are metropolitan areas. I’ll update these tables throughout the month as additional data is released.
Closed sales in November were mostly for contracts signed in September and October. Since 30-year fixed mortgage rates were in the 7.2% in September, and 7.6% in October, compared to the mid-6% range the previous year, closed sales were down year-over-year in November.
...
And a table of November sales.
In November, sales in these markets were down 9.4%. In October, these same markets were down 11.6% YoY Not Seasonally Adjusted (NSA).
Sales in all of these markets are down sharply compared to November 2019.
...
This early data suggests the November existing home sales report will show another significant YoY decline, perhaps close to the cycle low of 3.79 million SAAR last month. This will be the 27th consecutive month with a YoY decline in sales.
Note that the low during the housing bust was 3.30 million in July 2010.
Many more local markets to come!

Why 25 to 54 is the Prime Working Age group for the Participation Rate
by Calculated Risk on 12/11/2023 10:30:00 AM
A reader asks if we could look at the participation rate for 25 to 64, as opposed to 25 to 54, since many people work until they receive Social Security and Medicare.
First, the BLS provides seasonally adjusted data for the "Prime" working age group (25 to 54), but only NSA data for the 55 to 64 cohort. So, this makes tracking a larger Prime+ group more difficult.
Second, the reason we use the 25 to 54 group is that the participation rate is fairly steady across the entire age spectrum.
 Here is a graph of the participation rate by age cohort for November (1983, 1993, 2003, 2013 and 2023 NSA). The participation rate dips a little for the 50 to 54 age group, but in general the participation rate is fairly steady from 25 to 54.
If we added 55 to 59 to the prime group, calling it prime+, we'd have to age adjust to track the participation rate over time.
Although the participation rate is increasing over time, it is still below the prime levels. When a large cohort is moving through that age group, that would push down the prime+ participation rate, and when a small cohort is passing through that would push up the prime+ participation rate.
This graph shows that older people are participating more over the last 40 years, and younger people are participating less. This is probably because people are healthier (older participation rate), and younger people are staying in school. Both positives!
Housing December 11th Weekly Update: Inventory Down 1.7% Week-over-week, Up 1.9% Year-over-year
by Calculated Risk on 12/11/2023 08:19:00 AM
Altos reports that active single-family inventory was down 1.7% week-over-week and is now up 1.9% year-over-year. Inventory will decrease seasonally for next few weeks (for the Holidays).
 Click on graph for larger image.
This inventory graph is courtesy of Altos Research.
As of December 8th, inventory was at 546 thousand (7-day average), compared to 556 thousand the prior week.
Year-to-date, inventory is up 11.3%.

The red line is for 2023. The black line is for 2019. Note that inventory is up from the record low for the same week in 2021, but below last year and still well below normal levels.
Inventory was up 1.9% compared to the same week in 2022 (last week it was up 1.0%), and down 34.1% compared to the same week in 2019 (last week down 34.9%).
Inventory is now solidly above the same week in 2020 levels (dark blue line).
Mike Simonsen discusses this data regularly on Youtube.
Sunday, December 10, 2023
Sunday Night Futures
by Calculated Risk on 12/10/2023 06:16:00 PM
Weekend:
• Schedule for Week of December 10, 2023
• FOMC Preview: No Change to Policy Expected
Monday:
• No major economic releases scheduled.
From CNBC: Pre-Market Data and Bloomberg futures S&P 500 futures are up 4 and DOW futures are up 38 (fair value).
Oil prices were down over the last week with WTI futures at $71.23 per barrel and Brent at $75.84 per barrel. A year ago, WTI was at $73, and Brent was at $78 - so WTI oil prices were down slightly year-over-year.
Here is a graph from Gasbuddy.com for nationwide gasoline prices. Nationally prices are at $3.12 per gallon. A year ago, prices were at $3.22 per gallon, so gasoline prices are down $0.10 year-over-year.
Realtor.com Reports Active Inventory UP 3.1% YoY; New Listings up 5.6% YoY
by Calculated Risk on 12/10/2023 04:00:00 PM
Realtor.com has monthly and weekly data on the existing home market. Here is their weekly report: Weekly Housing Trends View — Data Week Ending December 2, 2023
• Active inventory increased slightly, with for-sale homes 3.1% above year ago levels. Active listings exceeded last year’s levels again this week, with the rate of increase picking up steam from the previous week (+3.1% year-over-year vs +1.8%). However, on an absolute basis, active inventory continued to fall below its peak earlier in the month, as is seasonally typical.
• New listings–a measure of sellers putting homes up for sale–were up this week, by 5.6% from one year ago. New listings registered lower than prior year levels from mid-2022 through roughly 6 weeks ago, as the mortgage rate lock-in effect froze homeowners with low-rate existing mortgages in place. More recently the trend has reversed as new listings during the week outpaced the same week in the previous year by 5.6%.
 Here is a graph of the year-over-year change in inventory according to realtor.com.
 Inventory was up year-over-year for the 4th consecutive week following 20 consecutive weeks with a YoY decrease in inventory.
Inventory is still historically very low.
New listings really collapsed a year ago, so the YoY comparison for new listings is easier now - and although new listings also remain well below "typical pre-pandemic levels", new listings are now up YoY.


