 RSS Feed
 by Calculated Risk on 12/13/2023 02:00:00 PM
Wednesday, December 13, 2023
FOMC Statement: No Change to Policy
Fed Chair Powell press conference video here or on YouTube here, starting at 2:30 PM ET.
FOMC Statement:
Recent indicators suggest that growth of economic activity has slowed from its strong pace in the third quarter. Job gains have moderated since earlier in the year but remain strong, and the unemployment rate has remained low. Inflation has eased over the past year but remains elevated.
The U.S. banking system is sound and resilient. Tighter financial and credit conditions for households and businesses are likely to weigh on economic activity, hiring, and inflation. The extent of these effects remains uncertain. The Committee remains highly attentive to inflation risks.
The Committee seeks to achieve maximum employment and inflation at the rate of 2 percent over the longer run. In support of these goals, the Committee decided to maintain the target range for the federal funds rate at 5-1/4 to 5-1/2 percent. The Committee will continue to assess additional information and its implications for monetary policy. In determining the extent of any additional policy firming that may be appropriate to return inflation to 2 percent over time, the Committee will take into account the cumulative tightening of monetary policy, the lags with which monetary policy affects economic activity and inflation, and economic and financial developments. In addition, the Committee will continue reducing its holdings of Treasury securities and agency debt and agency mortgage-backed securities, as described in its previously announced plans. The Committee is strongly committed to returning inflation to its 2 percent objective.
In assessing the appropriate stance of monetary policy, the Committee will continue to monitor the implications of incoming information for the economic outlook. The Committee would be prepared to adjust the stance of monetary policy as appropriate if risks emerge that could impede the attainment of the Committee's goals. The Committee's assessments will take into account a wide range of information, including readings on labor market conditions, inflation pressures and inflation expectations, and financial and international developments.
Voting for the monetary policy action were Jerome H. Powell, Chair; John C. Williams, Vice Chair; Michael S. Barr; Michelle W. Bowman; Lisa D. Cook; Austan D. Goolsbee; Patrick Harker; Philip N. Jefferson; Neel Kashkari; Adriana D. Kugler; Lorie K. Logan; and Christopher J. Waller.
emphasis added
Part 2: Current State of the Housing Market; Overview for mid-December
by Calculated Risk on 12/13/2023 10:28:00 AM
Today, in the Calculated Risk Real Estate Newsletter: Part 2: Current State of the Housing Market; Overview for mid-December
A brief excerpt:
Yesterday, in Part 1: Current State of the Housing Market; Overview for mid-December I reviewed home inventory and sales.There is much more in the article. You can subscribe at https://calculatedrisk.substack.com/
...
Other measures of house prices suggest prices will be up further YoY in the October Case-Shiller index. The NAR reported median prices were up 3.4% YoY in October, up from 2.4% YoY in September. ICE / Black Knight reported prices were up 4.6% YoY in October, up from 4.2% YoY in September to new all-time highs, and Freddie Mac reported house prices were up 6.0% YoY in October, up from 5.1% YoY in September - and also to new all-time highs.
Here is a comparison of year-over-year change in the FMHPI, median house prices from the NAR, and the Case-Shiller National index.
The FMHPI and the NAR median prices appear to be leading indicators for Case-Shiller. Based on recent monthly data, and the FMHPI, the YoY change in the Case-Shiller index will increase further in the report for October.

MBA: Mortgage Applications Increased in Weekly Survey
by Calculated Risk on 12/13/2023 07:00:00 AM
From the MBA: Mortgage Applications Increase in Latest MBA Weekly Survey
Mortgage applications increased 7.4 percent from one week earlier, according to data from the Mortgage Bankers Association’s (MBA) Weekly Mortgage Applications Survey for the week ending December 8, 2023.
The Market Composite Index, a measure of mortgage loan application volume, increased 7.4 percent on a seasonally adjusted basis from one week earlier. On an unadjusted basis, the Index increased 6 percent compared with the previous week. The Refinance Index increased 19 percent from the previous week and was 27 percent higher than the same week one year ago. The seasonally adjusted Purchase Index increased 4 percent from one week earlier. The unadjusted Purchase Index decreased 1 percent compared with the previous week and was 18 percent lower than the same week one year ago.
“Mortgage rates dropped last week, as incoming data point to a slowing economy and support a pivot by the Federal Reserve to begin cutting rates next year. The average 30-year fixed mortgage rate declined to 7.07 percent, the lowest level since July,” said Mike Fratantoni, MBA’s SVP and Chief Economist. “Borrowers who had seen rates near 8 percent earlier this fall are now seeing some lenders quote rates below 7 percent. Refinance volume picked up in response to this drop in rates, with a particularly notable increase for FHA and VA refinance applications. Purchase volume was running about 18 percent below last year’s pace, as prospective homebuyers are still challenged by a lack of inventory, even if rates have decreased.”
...
The average contract interest rate for 30-year fixed-rate mortgages with conforming loan balances ($726,200 or less) decreased to 7.07 percent from 7.17 percent, with points decreasing to 0.59 from 0.60 (including the origination fee) for 80 percent loan-to-value ratio (LTV) loans
emphasis added
 Click on graph for larger image.
The first graph shows the MBA mortgage purchase index.
According to the MBA, purchase activity is down 18% year-over-year unadjusted.
Red is a four-week average (blue is weekly).
Purchase application activity is up from the lows in late October and early November, but still below the lowest levels during the housing bust.

The second graph shows the refinance index since 1990.
With higher mortgage rates, the refinance index declined sharply in 2022, and even with the large week-to-week increase, activity is barely off the bottom.
Tuesday, December 12, 2023
Wednesday: FOMC Statement, PPI
by Calculated Risk on 12/12/2023 07:19:00 PM
 Note: Mortgage rates are from MortgageNewsDaily.com and are for top tier scenarios.
Wednesday:
• At 7:00 AM ET, The Mortgage Bankers Association (MBA) will release the results for the mortgage purchase applications index.
• At 8:30 AM, The Producer Price Index for November from the BLS. The consensus is for a 0.1% increase in PPI, and a 0.2% increase in core PPI.
• At 2:00 PM, FOMC Meeting Announcement. No change to policy is expected at this meeting.
• Also at 2:00 PM, FOMC Forecasts This will include the Federal Open Market Committee (FOMC) participants' projections of the appropriate target federal funds rate along with the quarterly economic projections.
• At 2:30 PM, Fed Chair Jerome Powell holds a press briefing following the FOMC announcement.
Part 1: Current State of the Housing Market; Overview for mid-December
by Calculated Risk on 12/12/2023 11:50:00 AM
Today, in the Calculated Risk Real Estate Newsletter: Part 1: Current State of the Housing Market; Overview for mid-December
A brief excerpt:
Here is a graph of new listing from Realtor.com’s November 2023 Monthly Housing Market Trends Report showing new listings were up 7.5% year-over-year in October. New listings are now up year-over-year mostly because new listings collapsed in the 2nd half of 2022. From Realtor.com:There is much more in the article. You can subscribe at https://calculatedrisk.substack.com/
Providing a boost to overall inventory, sellers turned out in higher numbers this November as newly listed homes were 7.5% above last year’s levels. This marked the end to a 17-month streak of declining listing activity.For the local markets I track that have reported so far, are also showing new listings up year-over-year in November.

Cleveland Fed: Median CPI increased 0.4% and Trimmed-mean CPI increased 0.3% in November
by Calculated Risk on 12/12/2023 11:00:00 AM
The Cleveland Fed released the median CPI and the trimmed-mean CPI.
According to the Federal Reserve Bank of Cleveland, the median Consumer Price Index rose 0.4% in November. The 16% trimmed-mean Consumer Price Index increased 0.3% in November. "The median CPI and 16% trimmed-mean CPI are measures of core inflation calculated by the Federal Reserve Bank of Cleveland based on data released in the Bureau of Labor Statistics’ (BLS) monthly CPI report".
 Click on graph for larger image.
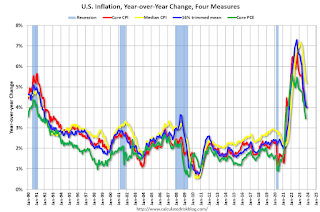
This graph shows the year-over-year change for these four key measures of inflation.
Note: The Cleveland Fed released the median CPI details. "Motor fuel" decreased at a 52% annualized rate in November. Rent and Owner's equivalent rent are still high, but decreasing.
According to the Federal Reserve Bank of Cleveland, the median Consumer Price Index rose 0.4% in November. The 16% trimmed-mean Consumer Price Index increased 0.3% in November. "The median CPI and 16% trimmed-mean CPI are measures of core inflation calculated by the Federal Reserve Bank of Cleveland based on data released in the Bureau of Labor Statistics’ (BLS) monthly CPI report".
 Click on graph for larger image.
This graph shows the year-over-year change for these four key measures of inflation.
On a year-over-year basis, the median CPI rose 5.2% (down from 5.3% in October), the trimmed-mean CPI rose 4.0% (down from 4.1%), and the CPI less food and energy rose 4.0% (unchanged from 4.0%).
Core PCE is for October was up 3.5% YoY, down from 3.7% in September.
Note: The Cleveland Fed released the median CPI details. "Motor fuel" decreased at a 52% annualized rate in November. Rent and Owner's equivalent rent are still high, but decreasing.
YoY Measures of Inflation: Services, Goods and Shelter
by Calculated Risk on 12/12/2023 09:21:00 AM
Here are a few measures of inflation:
The first graph is the one Fed Chair Powell had mentioned earlier when services less rent of shelter was up 7.6% year-over-year. This declined sharply and is now up 3.5% YoY.
 Click on graph for larger image.
This graph shows the YoY price change for Services and Services less rent of shelter through November 2023.
Services were up 5.2% YoY as of November 2023, up from 5.1% YoY in October.
Services less rent of shelter was up 3.5% YoY in November, up from 3.0% YoY in October.
Services less rent of shelter was up 3.5% YoY in November, up from 3.0% YoY in October.
 The second graph shows that goods prices started to increase year-over-year (YoY) in 2020 and accelerated in 2021 due to both strong demand and supply chain disruptions.
Durables were at -1.6% YoY as of November 2023, up from -2.1% YoY in October.
Commodities less food and energy commodities were unchanged YoY in November, unchanged from 0.0% YoY in October.
Commodities less food and energy commodities were unchanged YoY in November, unchanged from 0.0% YoY in October.
Goods inflation was transitory.
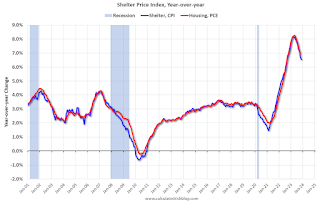 Here is a graph of the year-over-year change in shelter from the CPI report (through November) and housing from the PCE report (through October 2023)
Shelter was up 6.5% year-over-year in November, down from 6.7% in October. Housing (PCE) was up 6.9% YoY in October, down from 7.2% in September.
The BLS noted this morning: "The index for shelter continued to rise in November"
Core CPI ex-shelter was up 2.1% YoY in November, up from 2.0% in October.
BLS: CPI Increased 0.1% in November; Core CPI increased 0.3%
by Calculated Risk on 12/12/2023 08:30:00 AM
The Consumer Price Index for All Urban Consumers (CPI-U) increased 0.1 percent in November on a seasonally adjusted basis, after being unchanged in October, the U.S. Bureau of Labor Statistics reported today. Over the last 12 months, the all items index increased 3.1 percent before seasonal adjustment.The YoY change in CPI and core CPI were at expectations, although the MoM change was slightly higher than expected. I'll post a graph later today after the Cleveland Fed releases the median and trimmed-mean CPI.
The index for shelter continued to rise in November, offsetting a decline in the gasoline index. The energy index fell 2.3 percent over the month as a 6.0-percent decline in the gasoline index more than offset increases in other energy component indexes. The food index increased 0.2 percent in November, after rising 0.3 percent in October. The index for food at home increased 0.1 percent over the month and the index for food away from home rose 0.4 percent.
The index for all items less food and energy rose 0.3 percent in November, after rising 0.2 percent in October. Indexes which increased in November include rent, owners' equivalent rent, medical care, and motor vehicle insurance. The indexes for apparel, household furnishings and operations, communication, and recreation were among those that decreased over the month.
The all items index rose 3.1 percent for the 12 months ending November, a smaller increase than the 3.2-percent increase for the 12 months ending October. The all items less food and energy index rose 4.0 percent over the last 12 months, as it did for the 12 months ending October. The energy index decreased 5.4 percent for the 12 months ending November, while the food index increased 2.9 percent over the last year.
emphasis added
Monday, December 11, 2023
Tuesday: CPI
by Calculated Risk on 12/11/2023 07:01:00 PM
 From Matthew Graham at Mortgage News Daily: Mortgage Rates Barely Budge, But Volatility Potential is Much Higher Tomorrow
Jobs aside, inflation is the biggest nemesis for bonds/rates and the Consumer Price Index (CPI) is the biggest monthly revelation on the state of inflation. That's precisely why tomorrow's volatility potential is higher. The latest CPI will be released at 8:30am. If it's higher than forecast, rates should rise. If it's lower, rates should fall. If it comes in very far from forecasts, the movement could be quite abrupt. [30 year fixed 7.10%]Tuesday:
emphasis added
• At 6:00 AM ET, NFIB Small Business Optimism Index for November.
• At 8:30 AM, The Consumer Price Index for November from the BLS. The consensus is for no change in CPI, and a 0.3% increase in core CPI. The consensus is for CPI to be up 3.1% year-over-year and core CPI to be up 4.0% YoY.
2nd Look at Local Housing Markets in November with Comparison to 2019
by Calculated Risk on 12/11/2023 12:47:00 PM
Today, in the Calculated Risk Real Estate Newsletter: 2nd Look at Local Housing Markets in November with Comparison to 2019
A brief excerpt:
NOTE: The tables for active listings, new listings and closed sales all include a comparison to November 2019 for each local market (some 2019 data is not available).There is much more in the article. You can subscribe at https://calculatedrisk.substack.com/
This is the second look at several early reporting local markets in November. I’m tracking about 40 local housing markets in the US. Some of the 40 markets are states, and some are metropolitan areas. I’ll update these tables throughout the month as additional data is released.
Closed sales in November were mostly for contracts signed in September and October. Since 30-year fixed mortgage rates were in the 7.2% in September, and 7.6% in October, compared to the mid-6% range the previous year, closed sales were down year-over-year in November.
...
And a table of November sales.
In November, sales in these markets were down 9.4%. In October, these same markets were down 11.6% YoY Not Seasonally Adjusted (NSA).
Sales in all of these markets are down sharply compared to November 2019.
...
This early data suggests the November existing home sales report will show another significant YoY decline, perhaps close to the cycle low of 3.79 million SAAR last month. This will be the 27th consecutive month with a YoY decline in sales.
Note that the low during the housing bust was 3.30 million in July 2010.
Many more local markets to come!


