 RSS Feed
 by Calculated Risk on 12/17/2023 06:11:00 PM
Sunday, December 17, 2023
Sunday Night Futures
Weekend:
• Schedule for Week of December 17, 2023
Monday:
• At 10:00 AM ET, The December NAHB homebuilder survey. The consensus is for a reading of 37, up from 34. Any number below 50 indicates that more builders view sales conditions as poor than good.
From CNBC: Pre-Market Data and Bloomberg futures S&P 500 and DOW futures are mostly unchanged (fair value).
Oil prices were up over the last week with WTI futures at $71.43 per barrel and Brent at $76.55 per barrel. A year ago, WTI was at $74, and Brent was at $80 - so WTI oil prices were down 5% year-over-year.
Here is a graph from Gasbuddy.com for nationwide gasoline prices. Nationally prices are at $3.04 per gallon. A year ago, prices were at $3.10 per gallon, so gasoline prices are down $0.06 year-over-year.
Hotels: Occupancy Rate Decreased 1.1% Year-over-year
by Calculated Risk on 12/17/2023 08:17:00 AM
U.S. hotel performance increased from the previous week, according to CoStar’s latest data through 9 December. ...The following graph shows the seasonal pattern for the hotel occupancy rate using the four-week average.
3-9 December 2023 (percentage change from comparable week in 2022):
• Occupancy: 58.7% (-1.1%)
• Average daily rate (ADR): US$153.36 (+4.5%)
• Revenue per available room (RevPAR): US$89.98 (+3.3%)
emphasis added
 Click on graph for larger image.
The red line is for 2023, black is 2020, blue is the median, and dashed light blue is for 2022. Dashed purple is for 2018, the record year for hotel occupancy.
The 4-week average of the occupancy rate is tracking close to last year, and above the median rate for the period 2000 through 2022 (Blue).
Note: Y-axis doesn't start at zero to better show the seasonal change.
The 4-week average of the occupancy rate will decline seasonally until early 2024.
Saturday, December 16, 2023
Real Estate Newsletter Articles this Week: The Coming Fed Rate Cuts and the Impact on Mortgage Rates
by Calculated Risk on 12/16/2023 02:11:00 PM
At the Calculated Risk Real Estate Newsletter this week:
• Part 1: Current State of the Housing Market; Overview for mid-December
• Part 2: Current State of the Housing Market; Overview for mid-December
• The Coming Fed Rate Cuts and the Impact on Mortgage Rates
• 3rd Look at Local Housing Markets in November with Comparison to 2019
• 2nd Look at Local Housing Markets in November with Comparison to 2019
This is usually published 4 to 6 times a week and provides more in-depth analysis of the housing market.
You can subscribe at https://calculatedrisk.substack.com/
Schedule for Week of December 17, 2023
by Calculated Risk on 12/16/2023 08:11:00 AM
The key economic reports this week are Housing Starts, New Home Sales, Existing Home Sales, the 3rd estimate of Q3 GDP, and November Personal income and outlays.
10:00 AM: The December NAHB homebuilder survey. The consensus is for a reading of 37, up from 34. Any number below 50 indicates that more builders view sales conditions as poor than good.
 8:30 AM: Housing Starts for November.
 This graph shows single and multi-family housing starts since 1968.
The consensus is for 1.360 million SAAR, down from 1.372 million SAAR.
7:00 AM ET: The Mortgage Bankers Association (MBA) will release the results for the mortgage purchase applications index.
 10:00 AM: Existing Home Sales for November from the National Association of Realtors (NAR). The consensus is for 3.78 million SAAR, down from 3.79 million.
The graph shows existing home sales from 1994 through the report last month.
8:30 AM: The initial weekly unemployment claims report will be released. The consensus is for 218 thousand, up from 202 thousand last week.
8:30 AM: Gross Domestic Product, 3rd quarter 2023 (Third estimate). The consensus is for real GDP at 5.2% annualized, unchanged from the second estimate of 5.2%.
8:30 AM: the Philly Fed manufacturing survey for December. The consensus is for a reading of -3.0, up from -5.9.
11:00 AM: the Kansas City Fed manufacturing survey for December.
8:30 AM: Durable Goods Orders for November. The consensus is for a 0.1% increase..
8:30 AM: Personal Income and Outlays for November. The consensus is for a 0.4% increase in personal income, and for a 0.3% increase in personal spending. And for no change in the PCE price index, and the Core PCE price index to increase 0.2%. PCE prices are expected to be up 2.8% YoY, and core PCE prices up 3.4% YoY.
 10:00 AM: New Home Sales for November from the Census Bureau.
 This graph shows New Home Sales since 1963. The dashed line is the sales rate for last month.
The consensus is for 695 thousand SAAR, up from 679 thousand in October.
10:00 AM: University of Michigan's Consumer sentiment index (Final for December).
10:00 AM: State Employment and Unemployment (Monthly) for November 2023
Friday, December 15, 2023
Dec 15th COVID Update: Hospitalizations Increased
by Calculated Risk on 12/15/2023 07:41:00 PM
 Note: Mortgage rates are from MortgageNewsDaily.com and are for top tier scenarios.
Due to changes at the CDC, weekly cases are no longer updated.
For deaths, I'm currently using 3 weeks ago for "now", since the most recent two weeks will be revised significantly.
Hospitalizations have more than tripled from a low of 5,150 in June 2023.
Hospitalizations are far below the peak of 150,000 in January 2022.
| COVID Metrics | ||||
|---|---|---|---|---|
| Now | Week Ago | Goal | ||
| Hospitalized2🚩 | 18,233 | 17,664 | ≤3,0001 | |
| Deaths per Week2 | 1,160 | 1,305 | ≤3501 | |
| 1my goals to stop weekly posts, 2Weekly for Currently Hospitalized, and Deaths 🚩 Increasing number weekly for Hospitalized and Deaths ✅ Goal met. | ||||
 Click on graph for larger image.
This graph shows the weekly (columns) number of deaths reported.
Weekly deaths have more than doubled from a low of 485 in early July. Weekly deaths are far below the weekly peak of 26,000 in January 2021.
And here is a new graph I'm following on COVID in wastewater as of Dec 9th:
 Note the recent surge in COVID.
This appears to be a leading indicator for COVID hospitalizations and deaths, and both will likely increase over the next several weeks.
Q4 GDP Tracking: 1.5% to 2.6% Range
by Calculated Risk on 12/15/2023 04:35:00 PM
From Goldman:
We left our Q4 GDP tracking estimate unchanged at +1.5% (qoq ar) and boosted our Q4 domestic final sales growth forecast by 0.1pp to +2.4% (qoq ar). [Dec 15th estimate]And from the Altanta Fed: GDPNow
emphasis added
The GDPNow model estimate for real GDP growth (seasonally adjusted annual rate) in the fourth quarter of 2023 is 2.6 percent on December 14, up from 1.2 percent on December 7. [Dec 14th estimate]
LA Port Inbound Traffic Increased in November
by Calculated Risk on 12/15/2023 10:06:00 AM
Notes: The expansion to the Panama Canal was completed in 2016 (As I noted several years ago), and some of the traffic that used the ports of Los Angeles and Long Beach is probably going through the canal. This might be impacting TEUs on the West Coast (recently the drought in Panama has slowed canal traffic).
Container traffic gives us an idea about the volume of goods being exported and imported - and usually some hints about the trade report since LA area ports handle about 40% of the nation's container port traffic.
The following graphs are for inbound and outbound traffic at the ports of Los Angeles and Long Beach in TEUs (TEUs: 20-foot equivalent units or 20-foot-long cargo container).
To remove the strong seasonal component for inbound traffic, the first graph shows the rolling 12-month average.
 Click on graph for larger image.
On a rolling 12-month basis, inbound traffic increased 2.2% in November compared to the rolling 12 months ending in October. Outbound traffic increased 0.2% compared to the rolling 12 months ending the previous month.
The 2nd graph is the monthly data (with a strong seasonal pattern for imports).
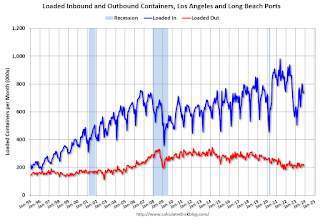 Usually imports peak in the July to October period as retailers import goods for the Christmas holiday, and then decline sharply and bottom in February or March depending on the timing of the Chinese New Year.
 Usually imports peak in the July to October period as retailers import goods for the Christmas holiday, and then decline sharply and bottom in February or March depending on the timing of the Chinese New Year.
 Imports were up 31% YoY in November, and exports were up 3% YoY.
In general, it appears port traffic is returning to the pre-pandemic patterns.
Industrial Production Increased 0.2% in November
by Calculated Risk on 12/15/2023 09:15:00 AM
From the Fed: Industrial Production and Capacity Utilization
In November, industrial production increased 0.2 percent, and manufacturing output rose 0.3 percent. The increase in manufacturing output was more than accounted for by a 7.1 percent bounceback in motor vehicles and parts production following the resolution of strikes at several major automakers. The index for manufacturing excluding motor vehicles and parts decreased 0.2 percent. The output of utilities moved down 0.4 percent, and the output of mines moved up 0.3 percent. Total industrial production in November was 0.4 percent below its year-earlier level. Capacity utilization moved up 0.1 percentage point to 78.8 percent in November, a rate that is 0.9 percentage point below its long-run (1972–2022) average.
emphasis added
 Click on graph for larger image.
This graph shows Capacity Utilization. This series is up from the record low set in April 2020, and above the level in February 2020 (pre-pandemic).
Capacity utilization at 78.8% is 0.9% below the average from 1972 to 2022. This was below consensus expectations.
Note: y-axis doesn't start at zero to better show the change.
 The second graph shows industrial production since 1967.
Industrial production increased to 102.7. This is above the pre-pandemic level.
Industrial production was slightly below consensus expectations.
Thursday, December 14, 2023
Friday: NY Fed Mfg, Industrial Production
by Calculated Risk on 12/14/2023 07:09:00 PM
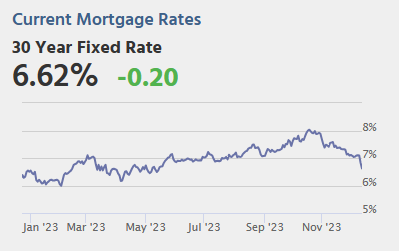 Note: Mortgage rates are from MortgageNewsDaily.com and are for top tier scenarios.
Friday:
• At 8:30 AM ET, The New York Fed Empire State manufacturing survey for December. The consensus is for a reading of 3.5, down from 9.1.
• At 9:15 AM, The Fed will release Industrial Production and Capacity Utilization for November.
The Coming Fed Rate Cuts and the Impact on Mortgage Rates
by Calculated Risk on 12/14/2023 01:27:00 PM
Today, in the Calculated Risk Real Estate Newsletter: The Coming Fed Rate Cuts and the Impact on Mortgage Rates
A brief excerpt:
Following the FOMC meeting, Goldman Sachs economists wrote:There is much more in the article. You can subscribe at https://calculatedrisk.substack.com/The soft PPI report on Tuesday morning combined with downward revisions to prior months implies that core PCE inflation was only 0.07% month-on-month and—as Chair Powell noted in the press conference—only 3.1% year-on-year in November. By some measures, the trend is already at or near 2%.Market participants are also pricing in one 25 bp cut in March, and 2nd in May, and a 3rd in June, bringing the Fed Funds target range down to 4.50% to 4.75% by June 12, 2024. With the Ten-Year yield currently at 3.93%, the yield curve would still be inverted in June.
In light of the faster return to target, we now expect the FOMC to cut earlier and faster. We now forecast three consecutive 25bp cuts in March, May, and June to reset the policy rate from a level that the FOMC will likely soon come to see as far offside, followed by quarterly cuts to a terminal rate of 3.25-3.5% …
emphasis added


