by Calculated Risk on 12/18/2023 10:00:00 AM
Monday, December 18, 2023
NAHB: Builder Confidence Increased in December
The National Association of Home Builders (NAHB) reported the housing market index (HMI) was at 37, up from 34 last month. Any number below 50 indicates that more builders view sales conditions as poor than good.
From the NAHB: Builder Sentiment Rises on Falling Interest Rates
Falling mortgage rates helped end a four-month decline in builder confidence, and recent economic data signal improving housing conditions heading into 2024.
Builder confidence in the market for newly built single-family homes rose three points to 37 in December, according to the National Association of Home Builders (NAHB)/Wells Fargo Housing Market Index (HMI) released today.
“With mortgage rates down roughly 50 basis points over the past month, builders are reporting an uptick in traffic as some prospective buyers who previously felt priced out of the market are taking a second look,” said NAHB Chairman Alicia Huey, a custom home builder and developer from Birmingham, Ala. “With the nation facing a considerable housing shortage, boosting new home production is the best way to ease the affordability crisis, expand housing inventory and lower inflation.”
“The housing market appears to have passed peak mortgage rates for this cycle, and this should help to spur home buyer demand in the coming months, with the HMI component measuring future sales expectations up six points in December,” said NAHB Chief Economist Robert Dietz.
Dietz added that the recent pessimism in builder confidence this fall has been somewhat counter to gains for the pace of single-family permits and starts during this time frame.
“Our statistical analysis indicates that temporary and outsized differences between builder sentiment and starts occur after short-term interest rates rise dramatically, increasing the cost of land development and builder loans used by private builders,” Dietz noted. “In turn, higher financing costs for home builders and land developers add another headwind for housing supply in a market low on resale inventory. While the Federal Reserve is fighting inflation, state and local policymakers could also help by reducing the regulatory burdens on the cost of land development and home building, thereby allowing more attainable housing supply to the market. Looking forward, as rates moderate, this temporary difference between sentiment and construction activity will decline.”
But with mortgage rates still running above 7% throughout November, per Freddie Mac data, many builders continue to reduce home prices to boost sales. In December, 36% of builders reported cutting home prices, tying the previous month’s high point for 2023. The average price reduction in December remained at 6%, unchanged from the previous month. Meanwhile, 60% of builders provided sales incentives of all forms in December, the same as November but down slightly from 62% in October.
...
The HMI index gauging traffic of prospective buyers in December rose three points 24, the component measuring sales expectations in the next six months increased six points to 45 and the component charting current sales condition held steady at 40.
Looking at the three-month moving averages for regional HMI scores, the Northeast increased two points to 51, the Midwest fell one point to 34, the South dropped three points to 39 and the West posted a four-point decline to 31.
emphasis added
 Click on graph for larger image.
This graph shows the NAHB index since Jan 1985.
This was at the consensus forecast.
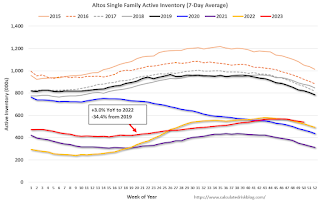
Housing December 18th Weekly Update: Inventory Down 1.4% Week-over-week, Up 3.0% Year-over-year
by Calculated Risk on 12/18/2023 08:12:00 AM
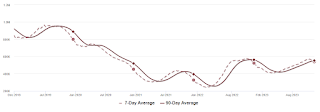 Click on graph for larger image.
This inventory graph is courtesy of Altos Research.
Sunday, December 17, 2023
Sunday Night Futures
by Calculated Risk on 12/17/2023 06:11:00 PM
Weekend:
• Schedule for Week of December 17, 2023
Monday:
• At 10:00 AM ET, The December NAHB homebuilder survey. The consensus is for a reading of 37, up from 34. Any number below 50 indicates that more builders view sales conditions as poor than good.
From CNBC: Pre-Market Data and Bloomberg futures S&P 500 and DOW futures are mostly unchanged (fair value).
Oil prices were up over the last week with WTI futures at $71.43 per barrel and Brent at $76.55 per barrel. A year ago, WTI was at $74, and Brent was at $80 - so WTI oil prices were down 5% year-over-year.
Here is a graph from Gasbuddy.com for nationwide gasoline prices. Nationally prices are at $3.04 per gallon. A year ago, prices were at $3.10 per gallon, so gasoline prices are down $0.06 year-over-year.
Hotels: Occupancy Rate Decreased 1.1% Year-over-year
by Calculated Risk on 12/17/2023 08:17:00 AM
U.S. hotel performance increased from the previous week, according to CoStar’s latest data through 9 December. ...The following graph shows the seasonal pattern for the hotel occupancy rate using the four-week average.
3-9 December 2023 (percentage change from comparable week in 2022):
• Occupancy: 58.7% (-1.1%)
• Average daily rate (ADR): US$153.36 (+4.5%)
• Revenue per available room (RevPAR): US$89.98 (+3.3%)
emphasis added
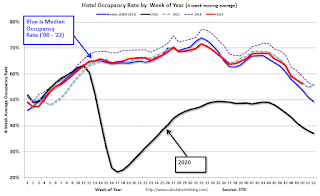 Click on graph for larger image.
The red line is for 2023, black is 2020, blue is the median, and dashed light blue is for 2022. Dashed purple is for 2018, the record year for hotel occupancy.
Saturday, December 16, 2023
Real Estate Newsletter Articles this Week: The Coming Fed Rate Cuts and the Impact on Mortgage Rates
by Calculated Risk on 12/16/2023 02:11:00 PM
At the Calculated Risk Real Estate Newsletter this week:
• Part 1: Current State of the Housing Market; Overview for mid-December
• Part 2: Current State of the Housing Market; Overview for mid-December
• The Coming Fed Rate Cuts and the Impact on Mortgage Rates
• 3rd Look at Local Housing Markets in November with Comparison to 2019
• 2nd Look at Local Housing Markets in November with Comparison to 2019
This is usually published 4 to 6 times a week and provides more in-depth analysis of the housing market.
You can subscribe at https://calculatedrisk.substack.com/
Schedule for Week of December 17, 2023
by Calculated Risk on 12/16/2023 08:11:00 AM
The key economic reports this week are Housing Starts, New Home Sales, Existing Home Sales, the 3rd estimate of Q3 GDP, and November Personal income and outlays.
10:00 AM: The December NAHB homebuilder survey. The consensus is for a reading of 37, up from 34. Any number below 50 indicates that more builders view sales conditions as poor than good.
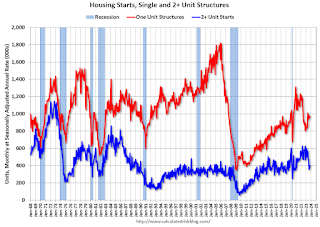 8:30 AM: Housing Starts for November.
 This graph shows single and multi-family housing starts since 1968.
The consensus is for 1.360 million SAAR, down from 1.372 million SAAR.
7:00 AM ET: The Mortgage Bankers Association (MBA) will release the results for the mortgage purchase applications index.
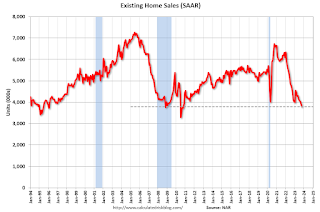 10:00 AM: Existing Home Sales for November from the National Association of Realtors (NAR). The consensus is for 3.78 million SAAR, down from 3.79 million.
The graph shows existing home sales from 1994 through the report last month.
8:30 AM: The initial weekly unemployment claims report will be released. The consensus is for 218 thousand, up from 202 thousand last week.
8:30 AM: Gross Domestic Product, 3rd quarter 2023 (Third estimate). The consensus is for real GDP at 5.2% annualized, unchanged from the second estimate of 5.2%.
8:30 AM: the Philly Fed manufacturing survey for December. The consensus is for a reading of -3.0, up from -5.9.
11:00 AM: the Kansas City Fed manufacturing survey for December.
8:30 AM: Durable Goods Orders for November. The consensus is for a 0.1% increase..
8:30 AM: Personal Income and Outlays for November. The consensus is for a 0.4% increase in personal income, and for a 0.3% increase in personal spending. And for no change in the PCE price index, and the Core PCE price index to increase 0.2%. PCE prices are expected to be up 2.8% YoY, and core PCE prices up 3.4% YoY.
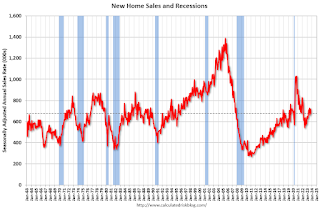 10:00 AM: New Home Sales for November from the Census Bureau.
 This graph shows New Home Sales since 1963. The dashed line is the sales rate for last month.
The consensus is for 695 thousand SAAR, up from 679 thousand in October.
10:00 AM: University of Michigan's Consumer sentiment index (Final for December).
10:00 AM: State Employment and Unemployment (Monthly) for November 2023
Friday, December 15, 2023
Dec 15th COVID Update: Hospitalizations Increased
by Calculated Risk on 12/15/2023 07:41:00 PM

| COVID Metrics | ||||
|---|---|---|---|---|
| Now | Week Ago | Goal | ||
| Hospitalized2🚩 | 18,233 | 17,664 | ≤3,0001 | |
| Deaths per Week2 | 1,160 | 1,305 | ≤3501 | |
| 1my goals to stop weekly posts, 2Weekly for Currently Hospitalized, and Deaths 🚩 Increasing number weekly for Hospitalized and Deaths ✅ Goal met. | ||||
 Click on graph for larger image.
This graph shows the weekly (columns) number of deaths reported.
And here is a new graph I'm following on COVID in wastewater as of Dec 9th:
 Note the recent surge in COVID.
This appears to be a leading indicator for COVID hospitalizations and deaths, and both will likely increase over the next several weeks.
Q4 GDP Tracking: 1.5% to 2.6% Range
by Calculated Risk on 12/15/2023 04:35:00 PM
From Goldman:
We left our Q4 GDP tracking estimate unchanged at +1.5% (qoq ar) and boosted our Q4 domestic final sales growth forecast by 0.1pp to +2.4% (qoq ar). [Dec 15th estimate]And from the Altanta Fed: GDPNow
emphasis added
The GDPNow model estimate for real GDP growth (seasonally adjusted annual rate) in the fourth quarter of 2023 is 2.6 percent on December 14, up from 1.2 percent on December 7. [Dec 14th estimate]
LA Port Inbound Traffic Increased in November
by Calculated Risk on 12/15/2023 10:06:00 AM
Notes: The expansion to the Panama Canal was completed in 2016 (As I noted several years ago), and some of the traffic that used the ports of Los Angeles and Long Beach is probably going through the canal. This might be impacting TEUs on the West Coast (recently the drought in Panama has slowed canal traffic).
Container traffic gives us an idea about the volume of goods being exported and imported - and usually some hints about the trade report since LA area ports handle about 40% of the nation's container port traffic.
The following graphs are for inbound and outbound traffic at the ports of Los Angeles and Long Beach in TEUs (TEUs: 20-foot equivalent units or 20-foot-long cargo container).
To remove the strong seasonal component for inbound traffic, the first graph shows the rolling 12-month average.

On a rolling 12-month basis, inbound traffic increased 2.2% in November compared to the rolling 12 months ending in October. Outbound traffic increased 0.2% compared to the rolling 12 months ending the previous month.
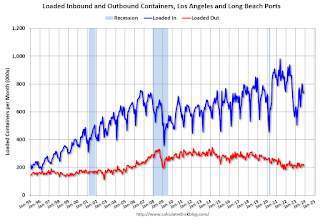 Usually imports peak in the July to October period as retailers import goods for the Christmas holiday, and then decline sharply and bottom in February or March depending on the timing of the Chinese New Year.
 Industrial Production Increased 0.2% in November
by Calculated Risk on 12/15/2023 09:15:00 AM
From the Fed: Industrial Production and Capacity Utilization
In November, industrial production increased 0.2 percent, and manufacturing output rose 0.3 percent. The increase in manufacturing output was more than accounted for by a 7.1 percent bounceback in motor vehicles and parts production following the resolution of strikes at several major automakers. The index for manufacturing excluding motor vehicles and parts decreased 0.2 percent. The output of utilities moved down 0.4 percent, and the output of mines moved up 0.3 percent. Total industrial production in November was 0.4 percent below its year-earlier level. Capacity utilization moved up 0.1 percentage point to 78.8 percent in November, a rate that is 0.9 percentage point below its long-run (1972–2022) average.
emphasis added
 Click on graph for larger image.
This graph shows Capacity Utilization. This series is up from the record low set in April 2020, and above the level in February 2020 (pre-pandemic).
Capacity utilization at 78.8% is 0.9% below the average from 1972 to 2022. This was below consensus expectations.
Note: y-axis doesn't start at zero to better show the change.
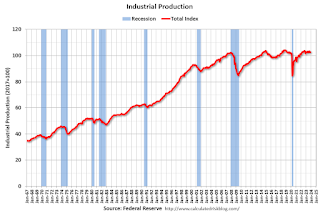 The second graph shows industrial production since 1967.
Industrial production increased to 102.7. This is above the pre-pandemic level.
Industrial production was slightly below consensus expectations.


