 RSS Feed
 by Calculated Risk on 12/21/2023 10:01:00 AM
Thursday, December 21, 2023
ICE: Mortgage Delinquency Rate Increased Slightly in November
From ICE (formerly Black Knight): ICE First Look at November Mortgage Performance: Delinquencies Historically Low Despite Seasonal Rise; Performance of Recent Originations Worth Watching
• The national delinquency rate edged higher to 3.39% in November – down 10 basis points (bps) from the same time last year – but remains 64 bps below pre-pandemic levels
• Likewise, early-stage delinquencies among VA loans hit their highest non-pandemic levels since 2009, as rising interest rates have begun to impact performance among recently originated loans
• Serious delinquencies (90+ days past due) rose to 459K, but remain down 123K (-21%) from November 2022
• Foreclosure starts decreased -12.2% in November to 29K with active foreclosure inventory falling to 216K, some 23% and 24% below 2019 levels respectively
• Prepayment activity fell again under continued pressure from seasonal homebuying patterns along with the residual effects of 30-year rates climbing above 7.75% the month prior
| Black Knight: Percent Loans Delinquent and in Foreclosure Process | ||||
|---|---|---|---|---|
| Nov 2023 | Oct 2023 | Nov 2022 | Nov 2019 | |
| Delinquent | 3.39% | 3.26% | 3.01% | 3.53% |
| In Foreclosure | 0.41% | 0.41% | 0.37% | 0.47% |
| Number of properties: | ||||
| Number of properties that are delinquent, but not in foreclosure: | 1,804,000 | 1,734,000 | 1,734,000 | 1,868,000 |
| Number of properties in foreclosure pre-sale inventory: | 216,000 | 217,000 | 196,000 | 248,000 |
| Total Properties | 2,020,000 | 1,951,000 | 1,808,000 | 2,116,000 |
Q3 GDP Growth Revised down to 4.9% Annual Rate
by Calculated Risk on 12/21/2023 08:38:00 AM
From the BEA: Gross Domestic Product (Third Estimate), Corporate Profits (Revised Estimate), and GDP by Industry, Third Quarter 2023
Real gross domestic product (GDP) increased at an annual rate of 4.9 percent in the third quarter of 2023, according to the "third" estimate released by the Bureau of Economic Analysis. In the second quarter, real GDP increased 2.1 percent.Here is a Comparison of Third and Second Estimates. PCE growth was revised down from 3.6% to 3.1%. Residential investment was revised up from 6.2% to 6.7%.
The GDP estimate released today is based on more complete source data than were available for the "second" estimate issued last month. In the second estimate, the increase in real GDP was 5.2 percent. The update primarily reflected a downward revision to consumer spending. Imports, which are a subtraction in the calculation of GDP, were revised down (refer to "Updates to GDP").
The increase in real GDP reflected increases in consumer spending, private inventory investment, exports, state and local government spending, federal government spending, residential fixed investment, and nonresidential fixed investment. Imports increased.
emphasis added
Weekly Initial Unemployment Claims Increase to 205,000
by Calculated Risk on 12/21/2023 08:30:00 AM
The DOL reported:
In the week ending December 16, the advance figure for seasonally adjusted initial claims was 205,000, an increase of 2,000 from the previous week's revised level. The previous week's level was revised up by 1,000 from 202,000 to 203,000. The 4-week moving average was 212,000, a decrease of 1,500 from the previous week's revised average. The previous week's average was revised up by 250 from 213,250 to 213,500.The following graph shows the 4-week moving average of weekly claims since 1971.
emphasis added
 Click on graph for larger image.
The dashed line on the graph is the current 4-week average. The four-week average of weekly unemployment claims decreased to 212,000.
The previous week was revised up.
Weekly claims were well below the consensus forecast.
Wednesday, December 20, 2023
Thursday: GDP, Unemployment Claims, Philly Fed Mfg
by Calculated Risk on 12/20/2023 07:52:00 PM
 Note: Mortgage rates are from MortgageNewsDaily.com and are for top tier scenarios.
Thursday:
• At 8:30 AM ET, The initial weekly unemployment claims report will be released. The consensus is for 218 thousand, up from 202 thousand last week.
• At 8:30 AM, Gross Domestic Product, 3rd quarter 2023 (Third estimate). The consensus is for real GDP at 5.2% annualized, unchanged from the second estimate of 5.2%.
• At 8:30 AM, the Philly Fed manufacturing survey for December. The consensus is for a reading of -3.0, up from -5.9.
• At 11:00 AM, the Kansas City Fed manufacturing survey for December.
Review: Ten Economic Questions for 2023
by Calculated Risk on 12/20/2023 02:05:00 PM
At the end of each year, I post Ten Economic Questions for the following year (2023). I followed up with a brief post on each question. Here is review (we don't have all data yet, but enough). I've linked to my posts from the beginning of the year, with a brief excerpt and a few comments.
I don't have a crystal ball, but I think it helps to outline what I think will happen - and understand - and change my mind, when the outlook is wrong. As an example, when the pandemic hit, I switched from being mostly positive on the economy to calling a recession in early March 2020.
Another example from last year: In December 2022, housing inventory was very low, but increasing quickly, and house prices were declining month-to-month, and I expected prices to decline slightly in 2023. However, when the inventory surge turned out to be a "head fake", I changed my mind!
Here were my questions from December 2022:
10) Question #10 for 2023: Will inventory increase further in 2023?
"The bottom line is inventory will probably increase year-over-year in 2023."

Here is a graph from Altos Research showing active single-family inventory through December 15, 2023.
The red line is for 2023. The black line is for 2019. Note that inventory is up from the record low for the same week in 2021, but still well below normal levels.
Inventory was up 3.0% compared to the same week in 2022 but still down 34.1% compared to the same week in 2019.
9) Question #9 for 2023: What will happen with house prices in 2023?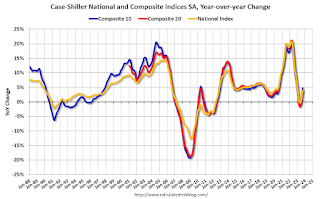 I was correct about prices not falling sharply, but house prices actually increased in 2023. That is why I changed my mind!
As of September, the National Case-Shiller index SA was up 3.9% year-over-year. (Case-Shiller for October will be released next week).
It appears prices will still be up mid-single digits in December.
8) Question #8 for 2023: How much will Residential investment change in 2023? How about housing starts and new home sales in 2023?
 I was expecting further weakness for new home sales early in the year, and new home sales actually bottomed in July 2022.
This graph shows new home sales for 2022 and 2023 by month (Seasonally Adjusted Annual Rate). Sales in October 2023 were up 17.7% from October 2022. Year-to-date sales are up 4.6% compared to the same period in 2022.
The low level of existing home inventory, combined with mortgage rate buydowns, helped new home sales increase in 2023.
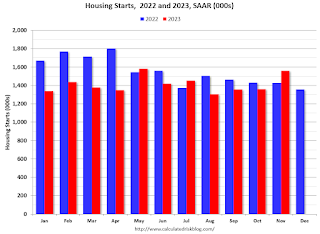 The next graph shows housing starts for 2022 and 2023 by month (Seasonally Adjusted Annual Rate).
Total starts year-to-date are down 9.9% compared to last year.
This was a somewhat smaller decline for total starts than I expected.
7) Question #7 for 2023: How much will wages increase in 2023?
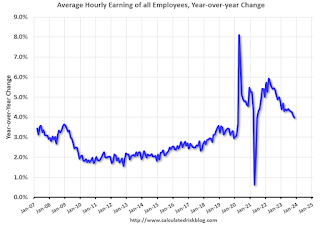 The graph shows the nominal year-over-year change in "Average Hourly Earnings" for all private employees from the Current Employment Statistics (CES).
9) Question #9 for 2023: What will happen with house prices in 2023?
"[M]ost homeowners have substantial equity, and a low fixed-rate mortgage, and they can afford the monthly payments. So, it is extremely unlikely that we see a surge in distressed sales like happened after the housing bubble. And that means prices probably won’t decline sharply like in 2008 when prices fell about 12% according to the Case-Shiller National Index.
So, based on my inventory and mortgage rate forecasts, my guess is that year-over-year house prices will decrease in 2023, probably in the low-to-mid single digit range. "
 I was correct about prices not falling sharply, but house prices actually increased in 2023. That is why I changed my mind!
As of September, the National Case-Shiller index SA was up 3.9% year-over-year. (Case-Shiller for October will be released next week).
It appears prices will still be up mid-single digits in December.
8) Question #8 for 2023: How much will Residential investment change in 2023? How about housing starts and new home sales in 2023?
"[M]y guess is that new home sales will bottom for this cycle in 2023, down another 15% to 20% from 2022 levels.
My guess is multi-family starts will decline in 2023 as rents soften and as the record number of housing units under construction are completed. Total starts will likely be down around 15% to 20% year-over-year in 2023, depending on how quickly multifamily starts slow down."
 I was expecting further weakness for new home sales early in the year, and new home sales actually bottomed in July 2022.
This graph shows new home sales for 2022 and 2023 by month (Seasonally Adjusted Annual Rate). Sales in October 2023 were up 17.7% from October 2022. Year-to-date sales are up 4.6% compared to the same period in 2022.
The low level of existing home inventory, combined with mortgage rate buydowns, helped new home sales increase in 2023.
 The next graph shows housing starts for 2022 and 2023 by month (Seasonally Adjusted Annual Rate).
Total starts year-to-date are down 9.9% compared to last year.
This was a somewhat smaller decline for total starts than I expected.
7) Question #7 for 2023: How much will wages increase in 2023?
"My sense is nominal wages will increase in the 3.0% to 3.5% YoY range in 2023 according to the CES."
 The graph shows the nominal year-over-year change in "Average Hourly Earnings" for all private employees from the Current Employment Statistics (CES).
 There was a huge increase at the beginning of the pandemic as lower paid employees were let go, and then the pandemic related spike reversed a year later.
Wage growth has trended down after peaking at 5.9% YoY in March 2022 and was at 4.0% YoY in November.
Wage growth has trended down after peaking at 5.9% YoY in March 2022 and was at 4.0% YoY in November.
Since wages increased sharply last December, it is likely YoY wage growth will slow further next month. Still somewhat above my guess.
6) Question #6 for 2023: What will the Fed Funds rate be in December 2023?
"My guess is there will be around 2 rate hikes in 2023, and if there are more, the FOMC will be under pressure later in 2023 to cut rates putting the Fed Funds rate under 5% at the end of 2023."There were 4 rate hikes in 2023 with the Fed Funds rate target range at 5-1/4 to 5-1/2 percent in December 2023. The Fed is now expected to cut rates in 2024.
5) Question #5 for 2023: What will the YoY core inflation rate be in December 2023?
"My guess is core PCE inflation (year-over-year) will decrease in 2023 (from the current 4.7%), and I think core PCE inflation will be below 3% by the end of 2023."According to the October Personal Income and Outlays report, the October PCE price index increased 3.0 percent year-over-year and the October PCE price index, excluding food and energy, increased 3.5 percent year-over-year. And PCE measures of inflation are expected to slow further in November and December.
4) Question #4 for 2023: What will the participation rate be in December 2023?
"There are probably a few more people that will return to the workforce in 2023, pushing up the participation rate. However, demographics will be pushing the rate down. So, my guess is the participation rate will be mostly unchanged year-over-year, around 62.3%."My guess was somewhat low since more people entered the labor force than I expected (also impacting job growth). The Labor Force Participation Rate was at 62.8% in November.
3) Question #3 for 2023: What will the unemployment rate be in December 2023?
"[M]y guess is the unemployment rate will increase to around 4% in December 2023 from the current 3.5%. (Lower than the FOMC forecast of 4.4% to 4.7%)."The unemployment rates was at 3.7% in November (this guess was looking good in October when the unemployment rate hit 3.9%).
2) Question #2 for 2023: How much will job growth slow in 2023? Or will the economy lose jobs?
"My sense is the FOMC is overly pessimistic, and my guess is there will be something like 400 to 800 thousand jobs added in 2023."
 This graph shows the jobs added per month since January 2021.
Through November the economy has added 2.55 million jobs, well above my guess. At least I was much closer than the Fed!
1) Question #1 for 2023: How much will the economy grow in 2023? Will there be a recession in 2023?
"My sense is growth will stay sluggish in 2023, but the economy will avoid recession. ... My guess is that real GDP growth will probably be positive in the 1.0% range in 2023.I was correct about no recession, but growth will likely be closer to 2.7% or so in 2023.
I was more optimistic than most analysts (no recession, positive job growth, inflation falling), but not optimistic enough!
My biggest misses were on house prices, new home sales, GDP and employment (all too pessimistic).
NAR: Existing-Home Sales Increased to 3.82 million SAAR in November; Months-of-Supply Close to 2019 Levels
by Calculated Risk on 12/20/2023 10:58:00 AM
Today, in the CalculatedRisk Real Estate Newsletter: NAR: Existing-Home Sales Increased to 3.82 million SAAR in November
Excerpt:
Sales Year-over-Year and Not Seasonally Adjusted (NSA)There is much more in the article. You can subscribe at https://calculatedrisk.substack.com/ Please subscribe!
The fourth graph shows existing home sales by month for 2022 and 2023.
Sales declined 7.3% year-over-year compared to November 2022. This was the twenty-seventh consecutive month with sales down year-over-year. This was just above the cycle low of 3.79 million SAAR last month.

NAR: Existing-Home Sales Increased to 3.82 million SAAR in November
by Calculated Risk on 12/20/2023 10:00:00 AM
From the NAR: Existing-Home Sales Expanded 0.8% in November, Ending Five-Month Slide
Existing-home sales grew in November, breaking a streak of five consecutive monthly declines, according to the National Association of REALTORS®. Among the four major U.S. regions, sales climbed in the Midwest and South but receded in the Northeast and West. All four regions experienced year-over-year sales decreases.
Total existing-home sales – completed transactions that include single-family homes, townhomes, condominiums and co-ops – elevated 0.8% from October to a seasonally adjusted annual rate of 3.82 million in November. Year-over-year, sales fell 7.3% (down from 4.12 million in November 2022).
...
Total housing inventory registered at the end of November was 1.13 million units, down 1.7% from October but up 0.9% from one year ago (1.12 million). Unsold inventory sits at a 3.5-month supply at the current sales pace, down from 3.6 months in October but up from 3.3 months in November 2022.
emphasis added
 Click on graph for larger image.
This graph shows existing home sales, on a Seasonally Adjusted Annual Rate (SAAR) basis since 1994.
Sales in November (3.82 million SAAR) were up 0.8% from the previous month and were 7.3% below the November 2022 sales rate.
The second graph shows nationwide inventory for existing homes.
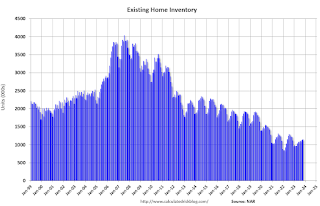 According to the NAR, inventory decreased to 1.13 million in November from 1.15 million the previous month.
 According to the NAR, inventory decreased to 1.13 million in November from 1.15 million the previous month.
Headline inventory is not seasonally adjusted, and inventory usually decreases to the seasonal lows in December and January, and peaks in mid-to-late summer.
The last graph shows the year-over-year (YoY) change in reported existing home inventory and months-of-supply. Since inventory is not seasonally adjusted, it really helps to look at the YoY change. Note: Months-of-supply is based on the seasonally adjusted sales and not seasonally adjusted inventory.
 Inventory was up 0.9% year-over-year (blue) in November compared to November 2022.
Months of supply (red) decreased to 3.5 months in November from 3.6 months the previous month.
This was above the consensus forecast. I'll have more later.
The last graph shows the year-over-year (YoY) change in reported existing home inventory and months-of-supply. Since inventory is not seasonally adjusted, it really helps to look at the YoY change. Note: Months-of-supply is based on the seasonally adjusted sales and not seasonally adjusted inventory.
 Inventory was up 0.9% year-over-year (blue) in November compared to November 2022.
 Months of supply (red) decreased to 3.5 months in November from 3.6 months the previous month.
This was above the consensus forecast. I'll have more later.
MBA: Mortgage Applications Decreased in Weekly Survey
by Calculated Risk on 12/20/2023 07:00:00 AM
From the MBA: Mortgage Applications Decrease in Latest MBA Weekly Survey
Mortgage applications decreased 1.5 percent from one week earlier, according to data from the Mortgage Bankers Association’s (MBA) Weekly Mortgage Applications Survey for the week ending December 15, 2023.
The Market Composite Index, a measure of mortgage loan application volume, decreased 1.5 percent on a seasonally adjusted basis from one week earlier. On an unadjusted basis, the Index decreased 3 percent compared with the previous week. The Refinance Index decreased 2 percent from the previous week and was 18 percent higher than the same week one year ago. The seasonally adjusted Purchase Index decreased 1 percent from one week earlier. The unadjusted Purchase Index decreased 4 percent compared with the previous week and was 18 percent lower than the same week one year ago.
"With the positive news about the drop in inflation, and the FOMC projections proclaiming a pivot towards rate cuts, the 30-year fixed mortgage rate reached its lowest level since June 2023, declining to 6.83 percent,” said Mike Fratantoni, MBA’s SVP and Chief Economist. "At least as of last week, borrowers' response to this rate move was rather tepid. VA refinance applications jumped 18 percent for the week, but otherwise, both refinance and purchase applications showed small declines."
...
The average contract interest rate for 30-year fixed-rate mortgages with conforming loan balances ($726,200 or less) decreased to 6.83 percent from 7.07 percent, with points increasing to 0.60 from 0.59 (including the origination fee) for 80 percent loan-to-value ratio (LTV) loans.
emphasis added
 Click on graph for larger image.
The first graph shows the MBA mortgage purchase index.
According to the MBA, purchase activity is down 18% year-over-year unadjusted.
Red is a four-week average (blue is weekly).
Purchase application activity is up from the lows in late October and early November, but still below the lowest levels during the housing bust.

The second graph shows the refinance index since 1990.
With higher mortgage rates, the refinance index declined sharply in 2022, and even with some recent minor increases, activity is barely off the bottom.
Tuesday, December 19, 2023
Wednesday: Existing Home Sales
by Calculated Risk on 12/19/2023 07:43:00 PM
 Note: Mortgage rates are from MortgageNewsDaily.com and are for top tier scenarios.
Wednesday:
• At 7:00 AM ET, The Mortgage Bankers Association (MBA) will release the results for the mortgage purchase applications index.
• At 10:00 AM, Existing Home Sales for November from the National Association of Realtors (NAR). The consensus is for 3.78 million SAAR, down from 3.79 million.
4th Look at Local Housing Markets in November, California Home Sales Down 6% YoY in October
by Calculated Risk on 12/19/2023 02:57:00 PM
Today, in the Calculated Risk Real Estate Newsletter: 4th Look at Local Housing Markets in November
A brief excerpt:
The National Association of Realtors (NAR) is scheduled to release November existing home sales tomorrow, Wednesday, December 20, 2023, at 10:00 AM ET. The consensus is for 3.78 million SAAR. Housing economist Tom Lawler expects the NAR to report sales of 3.87 million SAAR.There is much more in the article. You can subscribe at https://calculatedrisk.substack.com/
The cycle low was last month at 3.79 million.
NOTE: The tables for active listings, new listings and closed sales all include a comparison to November 2019 for each local market (some 2019 data is not available).
This is the fourth look at several early reporting local markets in November. I’m tracking about 40 local housing markets in the US. Some of the 40 markets are states, and some are metropolitan areas. I’ll update these tables throughout the month as additional data is released.
Closed sales in November were mostly for contracts signed in September and October. Since 30-year fixed mortgage rates were in the 7.2% in September, and 7.6% in October, compared to the mid-6% range the previous year, closed sales were down year-over-year in November.
...
And a table of November sales.
In November, sales in these markets were down 6.0% YoY. In October, these same markets were down 9.2% YoY Not Seasonally Adjusted (NSA). Note that sales were up YoY in Austin, Houston and mid-Florida.
Sales in all of these markets are down compared to November 2019, although sales in Houston were close to 2019 levels.
...
The data released so far suggests the November existing home sales report will show another YoY decline, likely above the cycle low of 3.79 million SAAR last month. This will be the 27th consecutive month with a YoY decline in sales.
Note that the low during the housing bust was 3.30 million in July 2010.
Several local markets - like Illinois, Miami, New Jersey and New York - will report after the NAR release.


