by Calculated Risk on 12/23/2023 08:11:00 AM
Saturday, December 23, 2023
Schedule for Week of December 24, 2023
Happy Holidays and Merry Christmas!
The key indicator this week is Case-Shiller House Prices for October.
All US markets will be closed in observance of the Christmas Holiday.
8:30 AM: Chicago Fed National Activity Index for November. This is a composite index of other data.
9:00 AM: FHFA House Price Index for October. This was originally a GSE only repeat sales, however there is also an expanded index.
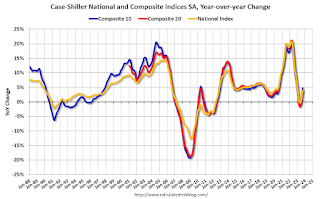 9:00 AM ET: S&P/Case-Shiller House Price Index for October.
This graph shows graph shows the Year over year change in the seasonally adjusted National Index, Composite 10 and Composite 20 indexes through the most recent report (the Composite 20 was started in January 2000).
The consensus is for an 5.0% year-over-year increase in the National index for October.
10:30 AM: Dallas Fed Survey of Manufacturing Activity for December.
10:00 AM: Richmond Fed Survey of Manufacturing Activity for December. This is the last of regional manufacturing surveys for December.
8:30 AM: The initial weekly unemployment claims report will be released. The consensus is for 210 thousand, up from 205 thousand last week.
10:00 AM: Pending Home Sales Index for November. The consensus is for a 0.9% increase in the index.
9:45 AM: Chicago Purchasing Managers Index for December.
Friday, December 22, 2023
Dec 22nd COVID Update: Hospitalizations Increased
by Calculated Risk on 12/22/2023 07:41:00 PM
| COVID Metrics | ||||
|---|---|---|---|---|
| Now | Week Ago | Goal | ||
| Hospitalized2🚩 | 19,686 | 18,708 | ≤3,0001 | |
| Deaths per Week2🚩 | 1,467 | 1,295 | ≤3501 | |
| 1my goals to stop weekly posts, 2Weekly for Currently Hospitalized, and Deaths 🚩 Increasing number weekly for Hospitalized and Deaths ✅ Goal met. | ||||
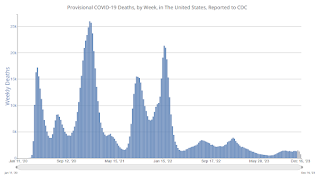 Click on graph for larger image.
This graph shows the weekly (columns) number of deaths reported.
AIA: "Architecture firm billings continue to decline in November"; Multi-family Billings Decline for 16th Consecutive Month
by Calculated Risk on 12/22/2023 03:20:00 PM
Note: This index is a leading indicator primarily for new Commercial Real Estate (CRE) investment.
From the AIA: ABI November 2023: Business conditions remain soft at architecture firms
Business conditions remained soft at architecture firms in November, as the AIA/Deltek Architecture Billings Index (ABI) remained below 50 with a score of 45.3 for the month (any score below 50 indicates declining billings). The score increased by one point from October, indicating that slightly fewer firms reported a decline in billings in November, but the majority of firms continued to report weak business for the fourth consecutive month, and the seventh month so far this year. However, there are still some encouraging signs of potential work in the pipeline as inquiries bounced back in November after declining in October. And while the value of new signed design contracts continued to decrease in November, fewer firms reported a decline than in October.• Regional averages: Northeast (44.4); South (46.7); Midwest (49.0); West (39.5)
Billings also remained weak at firms around the country in November, with firms in all regions reporting a decline for the fourth consecutive month. Business conditions remained softest at firms located in the West, which has been the case since March. And firms of all specializations also reported declining billings this month, with conditions remaining weakest at firms with a multifamily residential specialization. Billings also continued to decline further at firms with an institutional specialization, which was the strongest sector earlier this year.
emphasis added
• Sector index breakdown: commercial/industrial (45.7); institutional (46.6); multifamily residential (42.1)
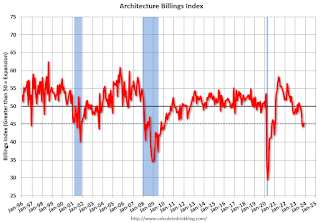 Click on graph for larger image.
This graph shows the Architecture Billings Index since 1996. The index was at 45.3 in November, up from 44.3 in October. Anything below 50 indicates a decrease in demand for architects' services.
Note: This includes commercial and industrial facilities like hotels and office buildings, multi-family residential, as well as schools, hospitals and other institutions.
This index usually leads CRE investment by 9 to 12 months, so this index suggests a slowdown in CRE investment in 2024.
Final Look at Local Housing Markets in November
by Calculated Risk on 12/22/2023 01:43:00 PM
Today, in the Calculated Risk Real Estate Newsletter: Final Look at Local Housing Markets in November
A brief excerpt:
I’ve added a comparison of active listings, new listings, and closings to the same month in 2019 (for markets with available data). This gives us a sense of the current low level of sales and inventory, and also shows some significant regional differences.There is much more in the article. You can subscribe at https://calculatedrisk.substack.com/
The big stories for November were that existing home sales were just above the cycle low on a seasonally adjusted annual rate basis (SAAR), and new listings were up YoY for the 2nd consecutive month!
This table shows the YoY change in new listings since early 2023 for the sample I track. The YoY increase in November was due to a combination of new listings collapsing in the 2nd half of 2022, and new listings holding up more than normal seasonally this year (but still historically very low).
This is the slow season for new listings, but it is likely new listings will be up solidly YoY in 2024.
...
More local data coming in January for activity in December!
New Home Sales decrease to 590,000 Annual Rate in November; Average New Home Price is Down 14% from the Peak
by Calculated Risk on 12/22/2023 10:53:00 AM
Today, in the Calculated Risk Real Estate Newsletter: New Home Sales decrease to 590,000 Annual Rate in November
Brief excerpt:
The Census Bureau reports New Home Sales in November were at a seasonally adjusted annual rate (SAAR) of 590 thousand. The previous three months were revised down.You can subscribe at https://calculatedrisk.substack.com/.
...
The next graph shows new home sales for 2022 and 2023 by month (Seasonally Adjusted Annual Rate). Sales in November 2023 were up 1.4% from November 2022. Year-to-date sales are up 3.9% compared to the same period in 2022.
Although sales disappointed in November, there will be more sales in 2023 than in 2022.
New Home Sales decrease to 590,000 Annual Rate in November
by Calculated Risk on 12/22/2023 10:00:00 AM
The Census Bureau reports New Home Sales in November were at a seasonally adjusted annual rate (SAAR) of 590 thousand.
The previous three months were revised down.
Sales of new single‐family houses in November 2023 were at a seasonally adjusted annual rate of 590,000, according to estimates released jointly today by the U.S. Census Bureau and the Department of Housing and Urban Development. This is 12.2 percent below the revised October rate of 672,000, but is 1.4 percent above the November 2022 estimate of 582,000.
emphasis added
 Click on graph for larger image.
The first graph shows New Home Sales vs. recessions since 1963. The dashed line is the current sales rate.
New home sales were slightly below pre-pandemic levels.
The second graph shows New Home Months of Supply.
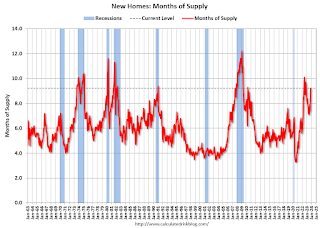 The months of supply increased in November to 9.2 months from 7.9 months in October.
 The all-time record high was 12.2 months of supply in January 2009. The all-time record low was 3.3 months in August 2020.
This is well above the top of the normal range (about 4 to 6 months of supply is normal).
"The seasonally‐adjusted estimate of new houses for sale at the end of November was 451,000. This represents a supply of 9.2 months at the current sales rate."Sales were well below expectations of 695 thousand SAAR, and sales for the three previous months were revised down. I'll have more later today.
PCE Measure of Shelter Slows to 6.7% YoY in November
by Calculated Risk on 12/22/2023 08:52:00 AM
Here is a graph of the year-over-year change in shelter from the CPI report and housing from the PCE report this morning, both through November 2023.
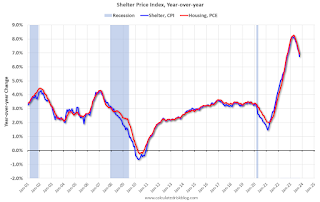
Since asking rents are mostly flat year-over-year, these measures will continue to slow over coming months.
Over the last 6 months (annualized):
PCE Price Index: 2.0%
Core PCE Prices: 1.9%
Core minus Housing: 1.1%
Personal Income increased 0.4% in November; Spending increased 0.2%
by Calculated Risk on 12/22/2023 08:30:00 AM
The BEA released the Personal Income and Outlays report for November:
Personal income increased $81.6 billion (0.4 percent at a monthly rate) in November, according to estimates released today by the Bureau of Economic Analysis. Disposable personal income (DPI), personal income less personal current taxes, increased $71.9 billion (0.4 percent) and personal consumption expenditures (PCE) increased $46.7 billion (0.2 percent).The November PCE price index increased 2.6 percent year-over-year (YoY), down from 2.9 percent YoY in October, and down from the recent peak of 7.1 percent in June 2022.
The PCE price index decreased 0.1 percent. Excluding food and energy, the PCE price index increased 0.1 percent. Real DPI increased 0.4 percent in November and real PCE increased 0.3 percent; goods increased 0.5 percent and services increased 0.2 percent.
emphasis added
The following graph shows real Personal Consumption Expenditures (PCE) through November 2023 (2012 dollars). Note that the y-axis doesn't start at zero to better show the change.
 Click on graph for larger image.
The dashed red lines are the quarterly levels for real PCE.
Personal income was at expectations, and PCE was slightly below expectations.
Using the two-month method to estimate Q4 real PCE growth, real PCE was increasing at a 2.3% annual rate in Q4 2023. (Using the mid-month method, real PCE was increasing at 3.1%). This suggests solid PCE growth in Q4.
Thursday, December 21, 2023
Friday: Personal Income and Outlays, Durable Goods, New Home Sales
by Calculated Risk on 12/21/2023 07:35:00 PM
Friday:
• At 8:30 AM ET, Durable Goods Orders for November. The consensus is for a 0.1% increase..
• Also at 8:30 AM, Personal Income and Outlays for November. The consensus is for a 0.4% increase in personal income, and for a 0.3% increase in personal spending. And for no change in the PCE price index, and the Core PCE price index to increase 0.2%. PCE prices are expected to be up 2.8% YoY, and core PCE prices up 3.4% YoY.
• At 10:00 AM, New Home Sales for November from the Census Bureau. The consensus is for 695 thousand SAAR, up from 679 thousand in October.
• Also at 10:00 AM, University of Michigan's Consumer sentiment index (Final for December).
• Also at 10:00 AM, State Employment and Unemployment (Monthly) for November 2023
December Vehicle Sales Forecast: 15.7 million SAAR, Up 16% YoY
by Calculated Risk on 12/21/2023 04:00:00 PM
From WardsAuto: December U.S. Light-Vehicle Sales Tracking to End Year on Positive Note (pay content). Brief excerpt:
Higher inventory and increased discounting, combined with a rebound in fleet deliveries, will lead December's results. With Q4 totaling a 15.5 million-unit annualized rate, sales in entire-2023 will total a 4-year-high 15.4 million units. Inventory will enter 2024 31% higher than a year ago.
emphasis added
 Click on graph for larger image.
This graph shows actual sales from the BEA (Blue), and Wards forecast for December (Red).
On a seasonally adjusted annual rate basis, the Wards forecast of 15.7 million SAAR, would be up 2.5% from last month, and up 16% from a year ago.


