 RSS Feed
 by Calculated Risk on 1/01/2024 09:54:00 AM
Monday, January 01, 2024
Housing January 1st Weekly Update: Inventory Down 2.9% Week-over-week, Up 4.4% Year-over-year
Altos reports that active single-family inventory was down 2.9% week-over-week and finished 2023 up 4.4% year-over-year. Inventory will likely decrease seasonally until the Spring.
 Click on graph for larger image.
This inventory graph is courtesy of Altos Research.
As of December 29th, inventory was at 513 thousand (7-day average), compared to 529 thousand the prior week.
Inventory finished 2023 up 4.4% year-over-year but is still far below pre-pandemic levels.

The red line is for 2023. The black line is for 2019. Note that inventory is up from the record low for the same week in 2021, but still well below normal levels.
Inventory was up 4.4% compared to the same week in 2022 (last week it was up 3.9%), and down 34.4% compared to the same week in 2019 (last week down 34.2%).
Back in June, inventory was down almost 54% compared to 2019, so the gap to more normal inventory levels is closing.
Mike Simonsen discusses this data regularly on Youtube.
Sunday, December 31, 2023
Update: Lumber Prices Up 9.6% YoY
by Calculated Risk on 12/31/2023 08:23:00 AM
Here is another monthly update on lumber prices.
Unfortunately, this impacts long term price comparisons since the new contract was priced about 24% higher than the old random length contract for the period when both contracts were available.
This graph shows CME random length framing futures through last August (blue), and the new physically-delivered Lumber Futures (LBR) contract starting in August 2022 (Red).
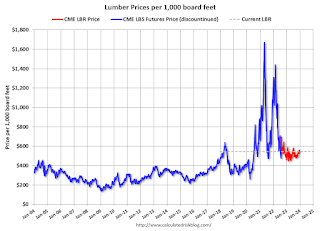 Click on graph for larger image.
We didn't see a significant runup in prices last Spring due to the housing slowdown, but we might see some pickup in early 2024.
This graph shows CME random length framing futures through last August (blue), and the new physically-delivered Lumber Futures (LBR) contract starting in August 2022 (Red).
LBR is currently at $544.00 per 1000 board feet, up 9.6% from $496.5 a year ago.
 Click on graph for larger image.
There is somewhat of a seasonal demand for lumber, and lumber prices usually peak in April or May.
We didn't see a significant runup in prices last Spring due to the housing slowdown, but we might see some pickup in early 2024.
Saturday, December 30, 2023
Real Estate Newsletter Articles this Week: Case-Shiller: National House Price Index Up 4.8% year-over-year
by Calculated Risk on 12/30/2023 02:11:00 PM
At the Calculated Risk Real Estate Newsletter this week:
• Case-Shiller: National House Price Index Up 4.8% year-over-year in October
• FHFA’s National Mortgage Database: Outstanding Mortgage Rates, LTV and Credit Scores
• Inflation Adjusted House Prices 2.4% Below Peak
• Question #10 for 2024: Will inventory increase further in 2024?
• Fannie and Freddie Serious Delinquencies in November: Single Family Mostly Unchanged, Multi-Family Increased
• Freddie Mac House Price Index Increased in November; Up 6.3% Year-over-year
This is usually published 4 to 6 times a week and provides more in-depth analysis of the housing market.
You can subscribe at https://calculatedrisk.substack.com/
Schedule for Week of December 31, 2023
by Calculated Risk on 12/30/2023 08:11:00 AM
Happy New Year! Wishing you all the best in 2024.
The key report this week is the December employment report on Friday.
Other key indicators include the December ISM manufacturing, December vehicle sales and November Job Openings.
The NYSE and the NASDAQ will be closed in observance of the New Year’s Day holiday
10:00 AM: Construction Spending for November. The consensus is for a 0.5% increase in construction spending.
7:00 AM ET: The Mortgage Bankers Association (MBA) will release the results for the mortgage purchase applications index.
 10:00 AM ET: Job Openings and Labor Turnover Survey for November from the BLS.
 This graph shows job openings (black line), hires (dark blue), Layoff, Discharges and other (red column), and Quits (light blue column) from the JOLTS.
Jobs openings decreased in October to 8.73 million from 9.35 million in September
10:00 AM: ISM Manufacturing Index for December. The consensus is for the ISM to be at 47.1, up from 46.7 in November.
2:00 PM: FOMC Minutes, Meeting of December 12-13, 2023
 Late: Light vehicle sales for December.
The Wards forecast is for 15.7 million SAAR in December, up from the BEA estimate of 15.32 million SAAR in November (Seasonally Adjusted Annual Rate).
This graph shows light vehicle sales since the BEA started keeping data in 1967. The dashed line is the current sales rate.
8:15 AM: The ADP Employment Report for December. This report is for private payrolls only (no government). The consensus is for 130,000, up from 103,000 jobs added in November.
8:30 AM: The initial weekly unemployment claims report will be released.
 8:30 AM: Employment Report for December. The consensus is for 158,000 jobs added, and for the unemployment rate to increase to 3.8%.
There were 199,000 jobs added in November, and the unemployment rate was at 3.7%.
This graph shows the jobs added per month since January 2021.
10:00 AM: the ISM Services Index for December.
Friday, December 29, 2023
Dec 29th COVID Update: Hospitalizations Increased
by Calculated Risk on 12/29/2023 07:33:00 PM
 Note: Mortgage rates are from MortgageNewsDaily.com and are for top tier scenarios.
Due to changes at the CDC, weekly cases are no longer updated.
For deaths, I'm currently using 3 weeks ago for "now", since the most recent two weeks will be revised significantly.
Hospitalizations have quadrupled from a low of 5,150 in June 2023.
Hospitalizations are far below the peak of 150,000 in January 2022.
| COVID Metrics | ||||
|---|---|---|---|---|
| Now | Week Ago | Goal | ||
| Hospitalized2🚩 | 21,597 | 20,050 | ≤3,0001 | |
| Deaths per Week2 | 1,464 | 1,545 | ≤3501 | |
| 1my goals to stop weekly posts, 2Weekly for Currently Hospitalized, and Deaths 🚩 Increasing number weekly for Hospitalized and Deaths ✅ Goal met. | ||||
 Click on graph for larger image.
This graph shows the weekly (columns) number of deaths reported.
Weekly deaths have tripled from a low of 485 in early July. Still weekly deaths are far below the weekly peak of 26,000 in January 2021.
And here is a new graph I'm following on COVID in wastewater as of Dec 28th:
 This appears to be a leading indicator for COVID hospitalizations and deaths.
COVID in wastewater is at the highest level since January 2022 (about half that peak), and that suggests deaths will likely increase significantly over the next several weeks.
Philly Fed: State Coincident Indexes Increased in 25 States in November (3-Month Basis)
by Calculated Risk on 12/29/2023 02:24:00 PM
From the Philly Fed:
The Federal Reserve Bank of Philadelphia has released the coincident indexes for the 50 states for November 2023. Over the past three months, the indexes increased in 25 states, decreased in 21 states, and remained stable in four, for a three-month diffusion index of 8. Additionally, in the past month, the indexes increased in 18 states, decreased in 21 states, and remained stable in 11, for a one-month diffusion index of -6. For comparison purposes, the Philadelphia Fed has also developed a similar coincident index for the entire United States. The Philadelphia Fed’s U.S. index increased 0.7 percent over the past three months and 0.3 percent in November.Note: These are coincident indexes constructed from state employment data. An explanation from the Philly Fed:
emphasis added
The coincident indexes combine four state-level indicators to summarize current economic conditions in a single statistic. The four state-level variables in each coincident index are nonfarm payroll employment, average hours worked in manufacturing by production workers, the unemployment rate, and wage and salary disbursements deflated by the consumer price index (U.S. city average). The trend for each state’s index is set to the trend of its gross domestic product (GDP), so long-term growth in the state’s index matches long-term growth in its GDP.
 Click on map for larger image.
Here is a map of the three-month change in the Philly Fed state coincident indicators. This map was all red during the worst of the Pandemic and also at the worst of the Great Recession.
The map is split between positive and negative on a three-month basis.
Source: Philly Fed.
 And here is a graph is of the number of states with one month increasing activity according to the Philly Fed.
 This graph includes states with minor increases (the Philly Fed lists as unchanged).
In November, 20 states had increasing activity on a single month basis, including minor increases.
In November, 20 states had increasing activity on a single month basis, including minor increases.
Freddie Mac House Price Index Increased in November; Up 6.3% Year-over-year
by Calculated Risk on 12/29/2023 11:11:00 AM
Today, in the Calculated Risk Real Estate Newsletter: Freddie Mac House Price Index Increased in November; Up 6.3% Year-over-year
A brief excerpt:
On a year-over-year basis, the National FMHPI was up 6.3% in November, from up 5.6% YoY in October. The YoY increase peaked at 19.1% in July 2021, and for this cycle, bottomed at up 0.9% YoY in April 2023. ...There is much more in the article. You can subscribe at https://calculatedrisk.substack.com/
As of November, 9 states and D.C. were below their previous peaks, Seasonally Adjusted. The largest seasonally adjusted declines from the recent peak were in Idaho (-4.2%), Utah (-2.0%), Louisiana (-1.7%), and Colorado (-1.4%).
For cities (Core-based Statistical Areas, CBSA), here are the 30 cities with the largest declines from the peak, seasonally adjusted. Austin continues to be the worst performing city.
...
I’ll have an update on the House Price Battle Royale: Low Inventory vs Affordability soon.

Question #10 for 2024: Will inventory increase further in 2024?
by Calculated Risk on 12/29/2023 08:35:00 AM
Today, in the Real Estate Newsletter: Question #10 for 2024: Will inventory increase further in 2024?
Brief excerpt:
Earlier I posted some questions on my blog for next year: Ten Economic Questions for 2024. Some of these questions concern real estate (inventory, house prices, housing starts, new home sales), and I’ll post thoughts on those in the newsletter (others like GDP and employment will be on my blog).There is much more in the article. You can subscribe at https://calculatedrisk.substack.com/
I'm adding some thoughts, and maybe some predictions for each question.
10) Housing Inventory: Housing inventory decreased sharply during the pandemic to record lows in early 2022. Since then, inventory has increased, but is still well below pre-pandemic levels. Will inventory increase further in 2024?
...
First, a brief history. Here are a few times when watching existing home inventory helped my analysis.
Starting in January 2005, I was very bearish on housing, but I wasn’t sure when the market would turn. Speculative bubbles can go on and on. However, the increase in inventory in late 2005 (see red arrow on graph) helped me call the top for house prices in 2006.Several years later, in early 2012, when many people were still bearish on housing, the plunge in inventory in 2011 (blue arrow on graph below) helped me call the bottom for house prices in early 2012 (see The Housing Bottom is Here).
...
Somewhat lower mortgage rates - and time - will likely lead to more new listings in 2024. Still, mortgage rates will remain well above the pandemic lows, and therefore new listings will be depressed again in 2024.
The bottom line is inventory will probably increase year-over-year in 2024. However, it seems unlikely that inventory will be back up to the 2019 levels. Inventory is always something to watch!

Thursday, December 28, 2023
Friday: Chicago PMI
by Calculated Risk on 12/28/2023 08:22:00 PM
 Note: Mortgage rates are from MortgageNewsDaily.com and are for top tier scenarios.
Friday:
• At 9:45 AM: Chicago Purchasing Managers Index for December.
Hotels: Occupancy Rate Increased 0.5% Year-over-year
by Calculated Risk on 12/28/2023 03:11:00 PM
As anticipated ahead of the holidays, U.S. hotel performance fell from the previous week, according to CoStar’s latest data through 23 December. ...The following graph shows the seasonal pattern for the hotel occupancy rate using the four-week average.
17-23 December 2023 (percentage change from comparable week in 2022):
• Occupancy: 43.9% (+0.5%)
• Average daily rate (ADR): US$131.97 (-0.9%)
• Revenue per available room (RevPAR): US$57.90 (-0.4%)
emphasis added
 Click on graph for larger image.
The red line is for 2023, black is 2020, blue is the median, and dashed light blue is for 2022. Dashed purple is for 2018, the record year for hotel occupancy.
The 4-week average of the occupancy rate is tracking close to last year, and above the median rate for the period 2000 through 2022 (Blue).
Note: Y-axis doesn't start at zero to better show the seasonal change.
The 4-week average of the occupancy rate will start increasing seasonally in the new year.


