by Calculated Risk on 1/03/2024 07:00:00 AM
Wednesday, January 03, 2024
MBA: Mortgage Applications Decreased Over a Two-Week Period in Latest Weekly Survey
From the MBA: Mortgage Applications Decreased Over a Two-Week Period in Latest MBA Weekly Survey
Mortgage applications decreased 9.4 percent from two weeks earlier, according to data from the Mortgage Bankers Association’s (MBA) Weekly Mortgage Applications Survey for the week ending December 29, 2023. The results include adjustments to account for the holidays.
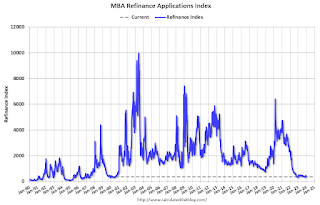
The Market Composite Index, a measure of mortgage loan application volume, decreased 9.4 percent on a seasonally adjusted basis from two weeks earlier. On an unadjusted basis, the Index decreased 38 percent compared with two weeks ago. The unadjusted Refinance Index decreased 43 percent from two weeks ago and was 15 percent higher than the same week one year ago. The seasonally adjusted Purchase Index decreased 5 percent compared with two weeks ago. The unadjusted Purchase Index decreased 34 percent compared with two weeks ago and was 12 percent lower than the same week one year ago.
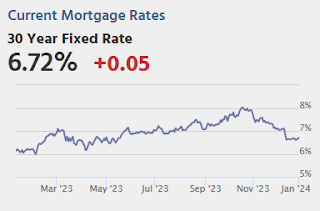
“Markets continued to digest the impact of slowing inflation and potential rate cuts from the Federal Reserve, helping mortgage rates to stay at levels close to the lowest since mid-2023. The 30-year fixed mortgage rate edged higher last week and ended 2023 at 6.76 percent, over a percentage point lower than its recent peak of 7.9 percent in October 2023,” said Joel Kan, MBA’s Vice President and Deputy Chief Economist. “The recent decline in rates has given the housing market some cause for optimism going into 2024, but purchase applications have not yet picked up in response, with the overall level of purchase activity 12 percent lower than a year ago. Refinance applications were still at very low levels, but were 15 percent higher than a year ago.”
Added Kan, “The housing market has been hampered by a limited supply of homes for sale, but the recent strength in new residential construction will continue to help ease inventory shortages in the months in come.”
...
The average contract interest rate for 30-year fixed-rate mortgages with conforming loan balances ($726,200 or less) increased to 6.76 percent from 6.71 percent, with points increasing to 0.61 from 0.55 (including the origination fee) for 80 percent loan-to-value ratio (LTV) loans. The effective rate increased from last week.
emphasis added
 Click on graph for larger image.
The first graph shows the MBA mortgage purchase index.
According to the MBA, purchase activity is down 12% year-over-year unadjusted.
Tuesday, January 02, 2024
Wednesday: Job Openings, ISM Mfg, FOMC Minutes
by Calculated Risk on 1/02/2024 07:27:00 PM
Wednesday:
• At 7:00 AM ET, The Mortgage Bankers Association (MBA) will release the results for the mortgage purchase applications index. (Two weeks!)
• At 10:00 AM, Job Openings and Labor Turnover Survey for November from the BLS.
• Also at 10:00 AM, ISM Manufacturing Index for December. The consensus is for the ISM to be at 47.1, up from 46.7 in November.
• At 2:00 PM, FOMC Minutes, Meeting of December 12-13, 2023
• Late, Light vehicle sales for December. The Wards forecast is for 15.7 million SAAR in December, up from the BEA estimate of 15.32 million SAAR in November (Seasonally Adjusted Annual Rate).
Question #9 for 2024: What will happen with house prices in 2024?
by Calculated Risk on 1/02/2024 12:25:00 PM
Today, in the Real Estate Newsletter: Question #9 for 2024: What will happen with house prices in 2024?
Brief excerpt:
Earlier I posted some questions on my blog for next year: Ten Economic Questions for 2024. Some of these questions concern real estate (inventory, house prices, housing starts, new home sales), and I’ll post thoughts on those in the newsletter (others like GDP and employment will be on my blog).There is much more in the article.
I'm adding some thoughts, and maybe some predictions for each question.
...
9) House Prices: It appears house prices - as measured by the national repeat sales index (Case-Shiller, FHFA, and Freddie Mac) - will be up mid-single digits in 2023. What will happen with house prices in 2024?
The first question I’m always asked is “What will happen with house prices?” No one has a crystal ball, and it depends on supply and demand.
...
This graph below shows existing home months-of-supply, inverted, from the National Association of Realtors® (NAR) vs. the seasonally adjusted month-to-month price change in the Case-Shiller National Index (both since January 1999 through October 2023). Note that the months-of-supply is not seasonally adjusted.
The recent months are in black (Oct 2023 in Blue) showing the impact of the initial surge in inventory in 2022 and prices fell for seven months with low levels of inventory!
The last several months are following the historic pattern.
In October, the months-of-supply was at 3.6 months, and the Case-Shiller National Index (SA) increased 0.65% month-over-month.
I don’t expect inventory to reach 2019 levels but based on the recent increase in inventory maybe more than half the gap between 2019 and 2023 levels will close in 2024. If existing home sales remain sluggish, we could see months-of-supply back to 2017 - 2019 levels.
Construction Spending Increased 0.4% in November
by Calculated Risk on 1/02/2024 10:00:00 AM
From the Census Bureau reported that overall construction spending increased:
Construction spending during November 2023 was estimated at a seasonally adjusted annual rate of $2,050.1 billion, 0.4 percent above the revised October estimate of $2,042.5 billion. The November figure is 11.3 percent above the November 2022 estimate of $1,842.2 billion.Private spending increased and public spending decreased:
emphasis added
Spending on private construction was at a seasonally adjusted annual rate of $1,595.0 billion, 0.7 percent above the revised October estimate of $1,584.4 billion. ...
In November, the estimated seasonally adjusted annual rate of public construction spending was $455.1 billion, 0.7 percent below the revised October estimate of $458.1 billion.
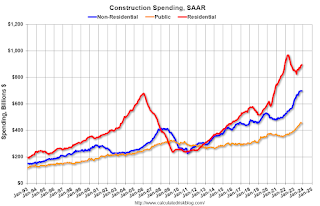 Click on graph for larger image.
This graph shows private residential and nonresidential construction spending, and public spending, since 1993. Note: nominal dollars, not inflation adjusted.
Residential (red) spending is 7.5% below the recent peak.
Non-residential (blue) spending is at a new peak.
Public construction spending is slightly below the peak in the previous month.
 The second graph shows the year-over-year change in construction spending.
On a year-over-year basis, private residential construction spending is up 3.7%. Non-residential spending is up 19.3% year-over-year. Public spending is up 16.2% year-over-year.
Monday, January 01, 2024
Tuesday: Construction Spending
by Calculated Risk on 1/01/2024 06:11:00 PM
Weekend:
• Schedule for Week of December 31, 2023
Tuesday:
• At 10:00 AM ET, Construction Spending for November. The consensus is for a 0.5% increase in construction spending.
From CNBC: Pre-Market Data and Bloomberg futures S&P 500 and DOW futures are down slightly (fair value).
Oil prices were down over the last week with WTI futures at $71.65 per barrel and Brent at $77.04 per barrel. A year ago, WTI was at $80, and Brent was at $83 - so WTI oil prices were down 10% year-over-year.
Here is a graph from Gasbuddy.com for nationwide gasoline prices. Nationally prices are at $3.05 per gallon. A year ago, prices were at $3.16 per gallon, so gasoline prices are down $0.11 year-over-year.
Housing January 1st Weekly Update: Inventory Down 2.9% Week-over-week, Up 4.4% Year-over-year
by Calculated Risk on 1/01/2024 09:54:00 AM
 Click on graph for larger image.
This inventory graph is courtesy of Altos Research.

Sunday, December 31, 2023
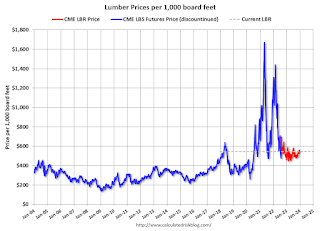
Update: Lumber Prices Up 9.6% YoY
by Calculated Risk on 12/31/2023 08:23:00 AM
This graph shows CME random length framing futures through last August (blue), and the new physically-delivered Lumber Futures (LBR) contract starting in August 2022 (Red).
Saturday, December 30, 2023
Real Estate Newsletter Articles this Week: Case-Shiller: National House Price Index Up 4.8% year-over-year
by Calculated Risk on 12/30/2023 02:11:00 PM
At the Calculated Risk Real Estate Newsletter this week:
• Case-Shiller: National House Price Index Up 4.8% year-over-year in October
• FHFA’s National Mortgage Database: Outstanding Mortgage Rates, LTV and Credit Scores
• Inflation Adjusted House Prices 2.4% Below Peak
• Question #10 for 2024: Will inventory increase further in 2024?
• Fannie and Freddie Serious Delinquencies in November: Single Family Mostly Unchanged, Multi-Family Increased
• Freddie Mac House Price Index Increased in November; Up 6.3% Year-over-year
This is usually published 4 to 6 times a week and provides more in-depth analysis of the housing market.
You can subscribe at https://calculatedrisk.substack.com/
Schedule for Week of December 31, 2023
by Calculated Risk on 12/30/2023 08:11:00 AM
Happy New Year! Wishing you all the best in 2024.
The key report this week is the December employment report on Friday.
Other key indicators include the December ISM manufacturing, December vehicle sales and November Job Openings.
The NYSE and the NASDAQ will be closed in observance of the New Year’s Day holiday
10:00 AM: Construction Spending for November. The consensus is for a 0.5% increase in construction spending.
7:00 AM ET: The Mortgage Bankers Association (MBA) will release the results for the mortgage purchase applications index.
 10:00 AM ET: Job Openings and Labor Turnover Survey for November from the BLS.
 This graph shows job openings (black line), hires (dark blue), Layoff, Discharges and other (red column), and Quits (light blue column) from the JOLTS.
Jobs openings decreased in October to 8.73 million from 9.35 million in September
10:00 AM: ISM Manufacturing Index for December. The consensus is for the ISM to be at 47.1, up from 46.7 in November.
2:00 PM: FOMC Minutes, Meeting of December 12-13, 2023
 Late: Light vehicle sales for December.
The Wards forecast is for 15.7 million SAAR in December, up from the BEA estimate of 15.32 million SAAR in November (Seasonally Adjusted Annual Rate).
This graph shows light vehicle sales since the BEA started keeping data in 1967. The dashed line is the current sales rate.
8:15 AM: The ADP Employment Report for December. This report is for private payrolls only (no government). The consensus is for 130,000, up from 103,000 jobs added in November.
8:30 AM: The initial weekly unemployment claims report will be released.
 8:30 AM: Employment Report for December. The consensus is for 158,000 jobs added, and for the unemployment rate to increase to 3.8%.
There were 199,000 jobs added in November, and the unemployment rate was at 3.7%.
This graph shows the jobs added per month since January 2021.
10:00 AM: the ISM Services Index for December.
Friday, December 29, 2023
Dec 29th COVID Update: Hospitalizations Increased
by Calculated Risk on 12/29/2023 07:33:00 PM

| COVID Metrics | ||||
|---|---|---|---|---|
| Now | Week Ago | Goal | ||
| Hospitalized2🚩 | 21,597 | 20,050 | ≤3,0001 | |
| Deaths per Week2 | 1,464 | 1,545 | ≤3501 | |
| 1my goals to stop weekly posts, 2Weekly for Currently Hospitalized, and Deaths 🚩 Increasing number weekly for Hospitalized and Deaths ✅ Goal met. | ||||
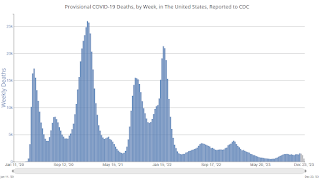 Click on graph for larger image.
This graph shows the weekly (columns) number of deaths reported.
And here is a new graph I'm following on COVID in wastewater as of Dec 28th:
 This appears to be a leading indicator for COVID hospitalizations and deaths.
