 RSS Feed
 by Calculated Risk on 1/06/2024 02:11:00 PM
Saturday, January 06, 2024
Real Estate Newsletter Articles this Week: What will happen with house prices in 2024?
At the Calculated Risk Real Estate Newsletter this week:
• Question #9 for 2024: What will happen with house prices in 2024?
• Asking Rents Mostly Unchanged Year-over-year
• Question #8 for 2024: How much will Residential investment change in 2024? How about housing starts and new home sales in 2024?
This is usually published 4 to 6 times a week and provides more in-depth analysis of the housing market.
Schedule for Week of January 7, 2024
by Calculated Risk on 1/06/2024 08:11:00 AM
The key reports this week are December CPI and the November trade deficit.
No major economic releases scheduled.
6:00 AM: NFIB Small Business Optimism Index for December.
 8:30 AM: Trade Balance report for November from the Census Bureau.
 This graph shows the U.S. trade deficit, with and without petroleum, through the most recent report. The blue line is the total deficit, and the black line is the petroleum deficit, and the red line is the trade deficit ex-petroleum products.
The consensus is the trade deficit to be $65.0 billion. The U.S. trade deficit was at $64.3 billion in October.
7:00 AM ET: The Mortgage Bankers Association (MBA) will release the results for the mortgage purchase applications index.
8:30 AM: The initial weekly unemployment claims report will be released. The consensus is for 215 thousand, up from 202 thousand.
8:30 AM: The Consumer Price Index for December from the BLS. The consensus is for 0.2% increase in CPI, and a 0.2% increase in core CPI. The consensus is for CPI to be up 3.2% year-over-year and core CPI to be up 3.9% YoY.
8:30 AM ET: The Producer Price Index for December from the BLS. The consensus is for a 0.1% increase in PPI, and a 0.2% increase in core PPI.
Friday, January 05, 2024
Jan 5th COVID Update: Deaths and Hospitalizations Increased
by Calculated Risk on 1/05/2024 07:47:00 PM
 Note: Mortgage rates are from MortgageNewsDaily.com and are for top tier scenarios.
Due to changes at the CDC, weekly cases are no longer updated.
For deaths, I'm currently using 4 weeks ago for "now", since the most recent three weeks will be revised significantly.
Hospitalizations have almost quintupled from a low of 5,150 in June 2023.
Hospitalizations are far below the peak of 150,000 in January 2022.
| COVID Metrics | ||||
|---|---|---|---|---|
| Now | Week Ago | Goal | ||
| Hospitalized2🚩 | 25,430 | 22,242 | ≤3,0001 | |
| Deaths per Week2🚩 | 1,614 | 1,605 | ≤3501 | |
| 1my goals to stop weekly posts, 2Weekly for Currently Hospitalized, and Deaths 🚩 Increasing number weekly for Hospitalized and Deaths ✅ Goal met. | ||||
 Click on graph for larger image.
This graph shows the weekly (columns) number of deaths reported.
Weekly deaths have more than tripled from a low of 485 in early July. Still weekly deaths are far below the weekly peak of 26,000 in January 2021.
And here is a new graph I'm following on COVID in wastewater as of Dec 30th:
 This appears to be a leading indicator for COVID hospitalizations and deaths.
COVID in wastewater is at the highest level since January 2022 (about 55% that peak), and that suggests deaths will likely increase further over the next several weeks.
Q4 GDP Tracking: 1.4% to 2.5%
by Calculated Risk on 1/05/2024 02:30:00 PM
From Goldman:
Following today’s data, we left our Q4 GDP tracking estimate unchanged at +1.4% (qoq ar) and our Q4 domestic final sales growth forecast unchanged at +2.2% (qoq ar). [Jan 5th estimate]And from the Altanta Fed: GDPNow
emphasis added
The GDPNow model estimate for real GDP growth (seasonally adjusted annual rate) in the fourth quarter of 2023 is 2.5 percent on January 3, up from 2.0 percent on January 2. [Jan 3rd estimate]
Question #7 for 2024: How much will wages increase in 2024?
by Calculated Risk on 1/05/2024 12:11:00 PM
Earlier I posted some questions on my blog for next year: Ten Economic Questions for 2024. Some of these questions concern real estate (inventory, house prices, housing starts, new home sales), and I’ll post thoughts on those in the newsletter (others like GDP and employment will be on this blog).
I'm adding some thoughts, and maybe some predictions for each question.
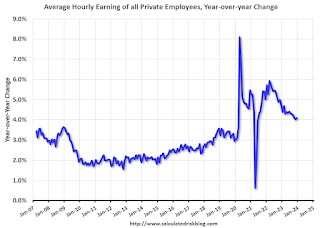
7) Wage Growth: Wage growth was solid in 2023, up 4.0% year-over-year as of November, but down from 4.8% YoY in 2022. How much will wages increase in 2024?
The most followed wage indicator is the “Average Hourly Earnings” from the Current Employment Statistics (CES) (aka "Establishment") monthly employment report.
 Click on graph for larger image.
The graph shows the nominal year-over-year change in "Average Hourly Earnings" for all private employees. There was a huge increase at the beginning of the pandemic as lower paid employees were let go, and then the pandemic related spike reversed a year later.
Real wage growth has trended down after peaking at 5.6% YoY in March 2022 and was at 4.1% YoY in December 2023. Although wage growth was above expectations in December, the trend is clearly down.
There are two quarterly sources for earnings data: 1) “Hourly Compensation,” from the BLS’s Productivity and Costs; and 2) the Employment Cost Index which includes wage/salary and benefit compensation. All three data series are different, and most of the focus recently has been the CES series (used in the graph above).
 The second graph is from the Atlanta Fed Wage Tracker. This measure is the year-over-year change in nominal wages for individuals.
By following wage changes for individuals, this removes the demographic composition effects (older workers who are retiring tend to be higher paid, and younger workers just entering the workforce tend to be lower paid).
The Atlanta Fed Wage tracker showed nominal wage growth increased sharply in 2021 and for most of 2022. In November 2023, the smoothed 3-month average wage growth was at 5.2% year-over-year, down from a peak of 6.7% in July 2022.
Clearly wage growth is slowing and I expect to see some further decreases in both the Average hourly earnings from the CES, and in the Atlanta Fed Wage Tracker. My sense is nominal wages will increase close to 3.5% YoY in 2024 according to the CES.
Here are the Ten Economic Questions for 2024 and a few predictions:
• Question #1 for 2024: How much will the economy grow in 2024? Will there be a recession in 2024?
• Question #2 for 2024: How much will job growth slow in 2024? Or will the economy lose jobs?
• Question #3 for 2024: What will the unemployment rate be in December 2024?
• Question #4 for 2024: What will the participation rate be in December 2024?
• Question #5 for 2024: What will the YoY core inflation rate be in December 2024?
• Question #6 for 2024: What will the Fed Funds rate be in December 2024?
• Question #7 for 2024: How much will wages increase in 2024?
• Question #8 for 2024: How much will Residential investment change in 2024? How about housing starts and new home sales in 2024?
• Question #9 for 2024: What will happen with house prices in 2024?
• Question #10 for 2024: Will inventory increase further in 2024?
Comments on December Employment Report
by Calculated Risk on 1/05/2024 09:26:00 AM
The headline jobs number in the December employment report was above expectations, however employment for the previous two months was revised down by 71,000, combined. The participation rate and the employment population ratio both decreased, and the unemployment rate was unchanged at 3.7%.
Leisure and hospitality gained 40 thousand jobs in December. At the beginning of the pandemic, in March and April of 2020, leisure and hospitality lost 8.2 million jobs, and are now down 163 thousand jobs since February 2020. So, leisure and hospitality has now added back about 98% all of the jobs lost in March and April 2020.
Construction employment increased 17 thousand and is now 448 thousand above the pre-pandemic level.
Manufacturing employment increased 6 thousand jobs and is now 201 thousand above the pre-pandemic level.
Seasonal Retail Hiring
Typically, retail companies start hiring for the holiday season in October, and really increase hiring in November. Here is a graph that shows the historical net retail jobs added for October, November and December by year.
 This graph really shows the collapse in retail hiring in 2008. Since then, seasonal hiring had increased back close to more normal levels. Note: I expect the long-term trend will be down with more and more internet holiday shopping.
Retailers hired 120 thousand workers Not Seasonally Adjusted (NSA) net in December. This was above last year.
This was seasonally adjusted (SA) to a gain of 17 thousand jobs in December.
Prime (25 to 54 Years Old) Participation
 Since the overall participation rate is impacted by both cyclical (recession) and demographic (aging population, younger people staying in school) reasons, here is the employment-population ratio for the key working age group: 25 to 54 years old.
The 25 to 54 years old participation rate declined in December to 83.2% from 83.3% in November, and the 25 to 54 employment population ratio declined to 80.4% from 80.7% the previous month.
Both are close to the pre-pandemic levels.
Average Hourly Wages
 The graph shows the nominal year-over-year change in "Average Hourly Earnings" for all private employees from the Current Employment Statistics (CES).
Average Hourly Wages
 The graph shows the nominal year-over-year change in "Average Hourly Earnings" for all private employees from the Current Employment Statistics (CES).
 There was a huge increase at the beginning of the pandemic as lower paid employees were let go, and then the pandemic related spike reversed a year later.
Wage growth has trended down after peaking at 5.9% YoY in March 2022 and was at 4.1% YoY in December.
Wage growth has trended down after peaking at 5.9% YoY in March 2022 and was at 4.1% YoY in December.
Part Time for Economic Reasons
 From the BLS report:
"The number of persons employed part time for economic reasons, at 4.2 million, changed little in December but was up by 333,000 over the year. These individuals, who would have preferred full-time employment, were working part time because their hours had been reduced or they were unable to find full-time jobs."The number of persons working part time for economic reasons decreased in December to 4.21 million from 3.99 million in November. This is at pre-recession levels.
These workers are included in the alternate measure of labor underutilization (U-6) that increased to 7.1% from 7.0% in the previous month. This is down from the record high in April 2020 of 23.0% and up from the lowest level on record (seasonally adjusted) in December 2022 (6.5%). (This series started in 1994). This measure is close to the 7.0% level in February 2020 (pre-pandemic).
Unemployed over 26 Weeks
 This graph shows the number of workers unemployed for 27 weeks or more.
 According to the BLS, there are 1.245 million workers who have been unemployed for more than 26 weeks and still want a job, up from 1.220 million the previous month.
This is down from post-pandemic high of 4.174 million, and up from the recent low of 1.050 million.
This is close to pre-pandemic levels.
Job Streak
Summary:
The headline monthly jobs number was above consensus expectations; however, employment for the previous two months was revised down by 71,000, combined. The participation rate and the employment population ratio both decreased, and the unemployment rate was unchanged at 3.7%.
This is close to pre-pandemic levels.
Job Streak
Through December 2023, the employment report indicated positive job growth for 36 consecutive months, putting the current streak in 5th place of the longest job streaks in US history (since 1939).
| Headline Jobs, Top 10 Streaks | ||
|---|---|---|
| Year Ended | Streak, Months | |
| 1 | 2019 | 100 |
| 2 | 1990 | 48 |
| 3 | 2007 | 46 |
| 4 | 1979 | 45 |
| 5 | 20231 | 36 |
| 6 tie | 1943 | 33 |
| 6 tie | 1986 | 33 |
| 6 tie | 2000 | 33 |
| 9 | 1967 | 29 |
| 10 | 1995 | 25 |
| 1Currrent Streak | ||
Summary:
The headline monthly jobs number was above consensus expectations; however, employment for the previous two months was revised down by 71,000, combined. The participation rate and the employment population ratio both decreased, and the unemployment rate was unchanged at 3.7%.
Another solid employment report.
December Employment Report: 216 thousand Jobs, 3.7% Unemployment Rate
by Calculated Risk on 1/05/2024 08:30:00 AM
From the BLS:
Total nonfarm payroll employment increased by 216,000 in December, and the unemployment rate was unchanged at 3.7 percent, the U.S. Bureau of Labor Statistics reported today. Employment continued to trend up in government, health care, social assistance, and construction, while transportation and warehousing lost jobs.
...
The change in total nonfarm payroll employment for October was revised down by 45,000, from +150,000 to +105,000, and the change for November was revised down by 26,000, from +199,000 to +173,000. With these revisions, employment in October and November combined is 71,000 lower than previously reported.
emphasis added
 Click on graph for larger image.
The first graph shows the jobs added per month since January 2021.
Total payrolls increased by 216 thousand in December. Private payrolls increased by 164 thousand, and public payrolls increased 52 thousand.
Payrolls for October and November were revised down 71 thousand, combined.
Payrolls for October and November were revised down 71 thousand, combined.
 The second graph shows the year-over-year change in total non-farm employment since 1968.
In December, the year-over-year change was 2.70 million jobs. Employment was up solidly year-over-year but has slowed closer to more normal levels of job growth recently.
The third graph shows the employment population ratio and the participation rate.
 The Labor Force Participation Rate decreased to 62.5% in December, from 62.8% in November. This is the percentage of the working age population in the labor force.
 The Employment-Population ratio decreased to 60.1% from 60.4% (blue line).
I'll post the 25 to 54 age group employment-population ratio graph later.
 The fourth graph shows the unemployment rate.
 The unemployment rate was unchanged at 3.7% in December from 3.7% in November.
This was above consensus expectations; however, October and November payrolls were revised down by 71,000 combined.
Thursday, January 04, 2024
Friday: Employment Report
by Calculated Risk on 1/04/2024 07:31:00 PM
 Note: Mortgage rates are from MortgageNewsDaily.com and are for top tier scenarios.
Friday:
• At 8:30 AM ET, Employment Report for December. The consensus is for 158,000 jobs added, and for the unemployment rate to increase to 3.8%.
• At 10:00 AM, the ISM Services Index for December
December Employment Preview
by Calculated Risk on 1/04/2024 01:27:00 PM
On Friday at 8:30 AM ET, the BLS will release the employment report for December. The consensus is for 158,000 jobs added, and for the unemployment rate to increase to 3.8%.
There were 199,000 jobs added in November, and the unemployment rate was at 3.7%.
From Goldman Sachs:
"We expect an above-consensus 190k increase in payrolls and a below-consensus 3.7% unemployment rate on Friday."• ADP Report: The ADP employment report showed 164,000 private sector jobs were added in December. This suggests job gains above consensus expectations, however, in general, ADP hasn't been very useful in forecasting the BLS report.
• ISM Surveys: Note that the ISM services are diffusion indexes based on the number of firms hiring (not the number of hires). The ISM® manufacturing employment index increased in December to 48.1%, down from 45.8% last month. This would suggest about 30,000 jobs lost in manufacturing. The ADP report indicated 13,000 manufacturing jobs lost in December.
The ISM® services employment index will be released after the employment report on Friday.
• Unemployment Claims: The weekly claims report showed a smaller number of initial unemployment claims during the reference week (the 3rd through the 9th in December) from 203,000 in November to 235,000 in December. This suggests fewer layoffs in December compared to November.
• COVID: As far as the pandemic, the number of patients hospitalized during the reference week in December was around 19,000, up from 13,000 in November.
• Conclusion: Fewer unemployment claims and favorable weather suggest a positive report in December. My guess is the headline number will be above the consensus.
Asking Rents Mostly Unchanged Year-over-year
by Calculated Risk on 1/04/2024 10:01:00 AM
Today, in the Real Estate Newsletter: Asking Rents Mostly Unchanged Year-over-year
Brief excerpt:
Here is a graph of the year-over-year (YoY) change for these measures since January 2015. Most of these measures are through November 2023, except CoreLogic is through October and Apartment List is through December 2023.There is much more in the article.
The CoreLogic measure is up 2.5% YoY in October, down from 2.6% in September, and down from a peak of 13.9% in April 2022.
The Zillow measure is up 3.3% YoY in November, mostly unchanged from 3.2% YoY in October, and down from a peak of 16.1% YoY in March 2022.
The ApartmentList measure is down 1.0% YoY as of December, up from -1.1% in November, and down from a peak of 18.2% YoY November 2021.
...
OER and CPI shelter will decline further in the CPI release next week.


