by Calculated Risk on 1/10/2024 07:00:00 AM
Wednesday, January 10, 2024
MBA: Mortgage Applications Increased in Weekly Survey
From the MBA: Mortgage Applications Increase in Latest MBA Weekly Survey
Mortgage applications increased 9.9 percent from one week earlier, according to data from the Mortgage Bankers Association’s (MBA) Weekly Mortgage Applications Survey for the week ending January 5, 2024. The results include an adjustment to account for the New Year’s holiday.
The Market Composite Index, a measure of mortgage loan application volume, increased 9.9 percent on a seasonally adjusted basis from one week earlier. On an unadjusted basis, the Index increased 45 percent compared with the previous week. The holiday adjusted Refinance Index increased 19 percent from the previous week and was 30 percent higher than the same week one year ago. The unadjusted Refinance Index increased 53 percent from the previous week and was 17 percent higher than the same week one year ago. The seasonally adjusted Purchase Index increased 6 percent from one week earlier. The unadjusted Purchase Index increased 40 percent compared with the previous week and was 16 percent lower than the same week one year ago.
“Despite an uptick in mortgage rates to start 2024, applications increased after adjusting for the holiday,” said Joel Kan, MBA’s Vice President and Deputy Chief Economist. “The increase in purchase and refinance applications for both conventional and government loans is promising to start the year but was likely due to some catch-up in activity after the holiday season and year-end rate declines. Mortgage rates and applications have been volatile in recent weeks and overall activity remains low.”
...
The average contract interest rate for 30-year fixed-rate mortgages with conforming loan balances ($726,200 or less) increased to 6.81 percent from 6.76 percent, with points remaining unchanged at 0.61 (including the origination fee) for 80 percent loan-to-value ratio (LTV) loans.
emphasis added
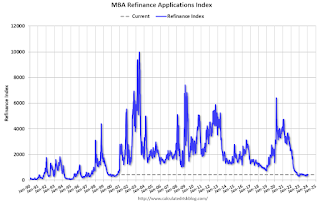
 Click on graph for larger image.
The first graph shows the MBA mortgage purchase index.
According to the MBA, purchase activity is down 16% year-over-year unadjusted.
Tuesday, January 09, 2024
Wednesday: Mortgage Applications
by Calculated Risk on 1/09/2024 07:48:00 PM
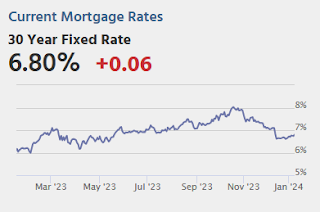
Wednesday:
• At 7:00 AM ET, The Mortgage Bankers Association (MBA) will release the results for the mortgage purchase applications index.
Question #3 for 2024: What will the unemployment rate be in December 2024?
by Calculated Risk on 1/09/2024 04:08:00 PM
Earlier I posted some questions on my blog for next year: Ten Economic Questions for 2024. Some of these questions concern real estate (inventory, house prices, housing starts, new home sales), and I’ll post thoughts on those in the newsletter (others like GDP and employment will be on this blog).
I'm adding some thoughts, and maybe some predictions for each question.
3) Unemployment Rate: The unemployment rate was at 3.7% in November, up from 3.6% in November 2022. Currently the FOMC is forecasting the unemployment rate will increase to the 4.0% to 4.2% range in Q4 2024. What will the unemployment rate be in December 2024?
Here is a graph of the unemployment rate over time. Note the period in the late '60s when the unemployment rate was mostly below 4% for four consecutive years.
 Click on graph for larger image.
The unemployment rate is from the household survey (CPS), and the rate was mostly flat in 2023. The unemployment rate increased in December to 3.7%, up from 3.5% in December 2022.
Forecasting the unemployment rate includes forecasts for economic and payroll growth, and also for changes in the participation rate (previous question).
Here is a table of the participation rate and unemployment rate since 2008.
| Unemployment and Participation Rate for December each Year | |||
|---|---|---|---|
| December of | Participation Rate | Change in Participation Rate (percentage points) | Unemployment Rate |
| 2008 | 65.8% | 7.3% | |
| 2009 | 64.6% | -1.2 | 9.9% |
| 2010 | 64.3% | -0.3 | 9.3% |
| 2011 | 64.0% | -0.3 | 8.5% |
| 2012 | 63.7% | -0.3 | 7.9% |
| 2013 | 62.9% | -0.8 | 6.7% |
| 2014 | 62.8% | -0.1 | 5.6% |
| 2015 | 62.7% | -0.1 | 5.0% |
| 2016 | 62.7% | 0.0 | 4.7% |
| 2017 | 62.7% | 0.0 | 4.1% |
| 2018 | 63.0% | 0.3 | 3.9% |
| 2019 | 63.3% | 0.3 | 3.6% |
| 2020 | 61.5% | -1.8 | 6.7% |
| 2021 | 62.0% | 0.5 | 3.9% |
| 2022 | 62.3% | 0.3 | 3.5% |
| 2023 | 62.5% | 0.2 | 3.7% |
Depending on the estimate for the participation rate and job growth (next question), my guess is the unemployment rate will remain in the mid-to-high 3% range in December 2024. (Lower than the FOMC forecast of 4.0% to 4.2%).
• Question #1 for 2024: How much will the economy grow in 2024? Will there be a recession in 2024?
• Question #2 for 2024: How much will job growth slow in 2024? Or will the economy lose jobs?
• Question #3 for 2024: What will the unemployment rate be in December 2024?
• Question #4 for 2024: What will the participation rate be in December 2024?
• Question #5 for 2024: What will the YoY core inflation rate be in December 2024?
• Question #6 for 2024: What will the Fed Funds rate be in December 2024?
• Question #7 for 2024: How much will wages increase in 2024?
• Question #8 for 2024: How much will Residential investment change in 2024? How about housing starts and new home sales in 2024?
• Question #9 for 2024: What will happen with house prices in 2024?
• Question #10 for 2024: Will inventory increase further in 2024?
1st Look at Local Housing Markets in December
by Calculated Risk on 1/09/2024 02:21:00 PM
Today, in the Calculated Risk Real Estate Newsletter: 1st Look at Local Housing Markets in December
A brief excerpt:
NOTE: The tables for active listings, new listings and closed sales all include a comparison to December 2019 for each local market (some 2019 data is not available).There is much more in the article.
This is the first look at several early reporting local markets in December. I’m tracking about 40 local housing markets in the US. Some of the 40 markets are states, and some are metropolitan areas. I’ll update these tables throughout the month as additional data is released.
Closed sales in December were mostly for contracts signed in October and November.
...
And a table of December sales.
In December, sales in these markets were down 7.9%. In November, these same markets were down 11.3% YoY Not Seasonally Adjusted (NSA).
Sales in all of these markets are down sharply compared to December 2019.
...
This was just several early reporting markets. Many more local markets to come!
Question #4 for 2024: What will the participation rate be in December 2024?
by Calculated Risk on 1/09/2024 11:11:00 AM
Earlier I posted some questions on my blog for next year: Ten Economic Questions for 2024. Some of these questions concern real estate (inventory, house prices, housing starts, new home sales), and I’ll post thoughts on those in the newsletter (others like GDP and employment will be on this blog).
I'm adding some thoughts, and maybe some predictions for each question.
4) Participation Rate: In November 2023, the overall participation rate was at 62.8%, up year-over-year from 62.2% in November 2022, but still below the pre-pandemic level of 63.3%. Long term, the BLS is projecting the overall participation rate will decline to 60.4% by 2032 due to demographics. What will the participation rate be in December 2024?
The overall labor force participation rate is the percentage of the working age population (16 + years old) in the labor force. A large portion of the decline in the participation rate since 2000 was due to demographics and long-term trends.
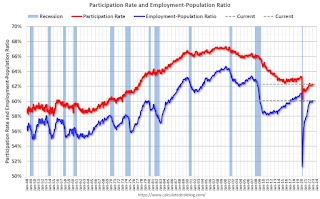
 The second graph shows the participation rate for "prime age" workers (25 to 54 years old). The 25 to 54 participation rate was at 83.2% in December 2023 Red), slightly above the pre-pandemic level of 83.0%. This suggests most of the prime age workers have returned to the labor force.
Here are the Ten Economic Questions for 2024 and a few predictions:
• Question #1 for 2024: How much will the economy grow in 2024? Will there be a recession in 2024?
• Question #2 for 2024: How much will job growth slow in 2024? Or will the economy lose jobs?
• Question #3 for 2024: What will the unemployment rate be in December 2024?
• Question #4 for 2024: What will the participation rate be in December 2024?
• Question #5 for 2024: What will the YoY core inflation rate be in December 2024?
• Question #6 for 2024: What will the Fed Funds rate be in December 2024?
• Question #7 for 2024: How much will wages increase in 2024?
• Question #8 for 2024: How much will Residential investment change in 2024? How about housing starts and new home sales in 2024?
• Question #9 for 2024: What will happen with house prices in 2024?
• Question #10 for 2024: Will inventory increase further in 2024?
Trade Deficit decreased to $63.2 Billion in November
by Calculated Risk on 1/09/2024 08:30:00 AM
The Census Bureau and the Bureau of Economic Analysis reported:
The U.S. Census Bureau and the U.S. Bureau of Economic Analysis announced today that the goods and services deficit was $63.2 billion in November, down $1.3 billion from $64.5 billion in October, revised.
November exports were $253.7 billion, $4.8 billion less than October exports. November imports were $316.9 billion, $6.1 billion less than October imports.
emphasis added
 Click on graph for larger image.
Both exports imports decreased in November.
Exports are up 0.4% year-over-year; imports are unchanged year-over-year.
Both imports and exports decreased sharply due to COVID-19 and then bounced back - imports and exports are moving sideways recently.
The second graph shows the U.S. trade deficit, with and without petroleum.
 The blue line is the total deficit, and the black line is the petroleum deficit, and the red line is the trade deficit ex-petroleum products.
Note that net, exports of petroleum products are positive and have been increasing.
The trade deficit with China increased to $21.6 billion from $21.1 billion a year ago.
CoreLogic: US Home Prices Increased 5.2% Year-over-year in November
by Calculated Risk on 1/09/2024 08:00:00 AM
Notes: This CoreLogic House Price Index report is for November. The recent Case-Shiller index release was for October. The CoreLogic HPI is a three-month weighted average and is not seasonally adjusted (NSA).
From CoreLogic: CoreLogic: US Home Price Growth Speeds Up Again in November
• U.S. home prices increased by 5.2% year over year in November, the strongest annual growth rate recorded since January 2023.
• Annual home price growth is projected to slow to 2.3% in the spring of 2024 before stabilizing for the rest of the year.
• Detroit was the nation’s fastest-appreciating metro area in November at 8.7%, ending Miami’s 16-month run in the top spot.
• Northeastern states again posted the nation’s largest price gains, with Rhode Island, Connecticut and New Jersey showing increases that were more than double the national rate.
...
“Home price appreciation continued to push forward in November, despite the new highs in mortgage rates seen over the year,” said Dr. Selma Hepp, chief economist for CoreLogic. “And while the annual growth reflects comparison with last year's declines, seasonal gains remain in line with historical averages. However, in some metro areas, such as those in the Mountain West and the Northwest, higher interest rates are having a greater impact on homebuyers’ budgets, which is contributing to a larger seasonal slump.
“This continued strength remains remarkable amid the nation’s affordability crunch but speaks to the pent-up demand that is driving home prices higher,” Hepp continued. “Markets where the prolonged inventory shortage has been exacerbated by the lack of new homes for sale recorded notable price gains over the course of 2023.”
emphasis added
Monday, January 08, 2024
Tuesday: Trade Deficit, CoreLogic House Prices
by Calculated Risk on 1/08/2024 07:10:00 PM
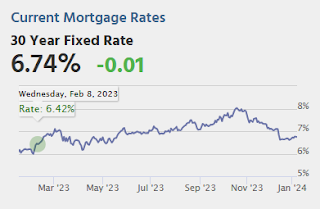
Thursday's Consumer Price Index (CPI) will be the week's most potentially consequential event. The most widely traded inflation report, CPI has been at the scene of many of the biggest interest rate changes of the past 2 years, but notably, such reactions require a result that is far from the consensus among economic forecasters. [30 year fixed 6.74%]Tuesday:
emphasis added
• At 6:00 AM ET, NFIB Small Business Optimism Index for December.
• At 8:00 AM, CoreLogic House prices for November.
• At 8:30 AM: Trade Balance report for November from the Census Bureau. The consensus is the trade deficit to be $65.0 billion. The U.S. trade deficit was at $64.3 billion in October.
Question #5 for 2024: What will the YoY core inflation rate be in December 2024?
by Calculated Risk on 1/08/2024 02:50:00 PM
Earlier I posted some questions on my blog for next year: Ten Economic Questions for 2024. Some of these questions concern real estate (inventory, house prices, housing starts, new home sales), and I’ll post thoughts on those in the newsletter (others like GDP and employment will be on this blog).
I'm adding some thoughts, and maybe some predictions for each question.
5) Inflation: Core PCE was up 3.2% YoY through November. This was down from a peak of 5.6% in early 2022. The FOMC is forecasting the YoY change in core PCE will be in the 2.4% to 2.7% range in Q4 2024. Will the core inflation rate decrease further in 2024, and what will the YoY core inflation rate be in December 2024?
Although there are different measures for inflation, they all show inflation above the Fed's 2% inflation target on a year-over-year basis.
Note: I follow several measures of inflation, including median CPI and trimmed-mean CPI from the Cleveland Fed. Also core PCE prices (monthly from the BEA) and core CPI (from the BLS).
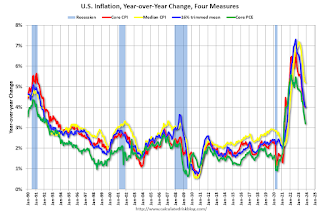
This graph shows the year-over-year change for four key measures of inflation.
PCE Price Index: 2.0%
Core PCE Prices: 1.9%
Here are the Ten Economic Questions for 2024 and a few predictions:
• Question #1 for 2024: How much will the economy grow in 2024? Will there be a recession in 2024?
• Question #2 for 2024: How much will job growth slow in 2024? Or will the economy lose jobs?
• Question #3 for 2024: What will the unemployment rate be in December 2024?
• Question #4 for 2024: What will the participation rate be in December 2024?
• Question #5 for 2024: What will the YoY core inflation rate be in December 2024?
• Question #6 for 2024: What will the Fed Funds rate be in December 2024?
• Question #7 for 2024: How much will wages increase in 2024?
• Question #8 for 2024: How much will Residential investment change in 2024? How about housing starts and new home sales in 2024?
• Question #9 for 2024: What will happen with house prices in 2024?
• Question #10 for 2024: Will inventory increase further in 2024?
Moody's: Apartment Vacancy Rate increased in Q4; Office Vacancy Rate in "Uncharted Territory" at Record High
by Calculated Risk on 1/08/2024 11:50:00 AM
Today, in the Calculated Risk Real Estate Newsletter: Moody's: Apartment Vacancy Rate increased in Q4; Office Vacancy Rate in "Uncharted Territory" at Record High
A brief excerpt:
From Moody’s:There is much more in the article.The national office vacancy rate rose 40 bps to a record-breaking 19.6%, shattering the previous record of 19.3% set twice previously: once in 1986 driven by a five-year period of significant inventory expansion and the other in 1991 during the Savings and Loans Crisis. This surge represented the largest quarterly increase since Q1 2021, setting the latest office vacancy 280 bps higher than its pre-pandemic level. ...Moody’s Analytics reported that the office vacancy rate was at 19.6% in Q4 2023, up from 18.8% in Q4 2022. This is a new record high, and above the 19.3% during the S&L crisis.


