by Calculated Risk on 1/11/2024 02:59:00 PM
Thursday, January 11, 2024
Cleveland Fed: Median CPI increased 0.4% and Trimmed-mean CPI increased 0.3% in December
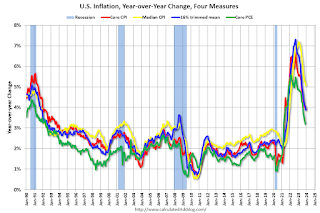
According to the Federal Reserve Bank of Cleveland, the median Consumer Price Index rose 0.4% in December. The 16% trimmed-mean Consumer Price Index increased 0.3% in November. "The median CPI and 16% trimmed-mean CPI are measures of core inflation calculated by the Federal Reserve Bank of Cleveland based on data released in the Bureau of Labor Statistics’ (BLS) monthly CPI report".
 Click on graph for larger image.
This graph shows the year-over-year change for these four key measures of inflation.
Note: The Cleveland Fed released the median CPI details. "Fuel oil and other fuels" decreased at a 33% annualized rate in December.
Part 2: Current State of the Housing Market; Overview for mid-January 2024
by Calculated Risk on 1/11/2024 11:53:00 AM
Today, in the Calculated Risk Real Estate Newsletter: Part 2: Current State of the Housing Market; Overview for mid-January 2024
A brief excerpt:
“If you do not know where you come from, then you don't know where you are, and if you don't know where you are, then you don't know where you're going. And if you don't know where you're going, you're probably going wrong.” Terry PratchettThere is much more in the article.
These “Current State” summaries show us where we came from, where we are, and hopefully give us clues as to where we are going!
Yesterday, in Part 1: Current State of the Housing Market; Overview for mid-January 2024 I reviewed home inventory and sales.
...
Other measures of house prices suggest prices will be up further YoY in the November Case-Shiller index. The NAR reported median prices were up 4.0% YoY in November, up from 3.4% YoY in October. ICE / Black Knight reported prices were up 5.1% YoY in November, up from 4.5% YoY in October to new all-time highs, and Freddie Mac reported house prices were up 6.3% YoY in November, up from 5.6% YoY in October - and also to new all-time highs.
Here is a comparison of year-over-year change in the FMHPI, median house prices from the NAR, and the Case-Shiller National index.
The FMHPI and the NAR median prices appear to be leading indicators for Case-Shiller. Based on recent monthly data, and the FMHPI, the YoY change in the Case-Shiller index will increase further in the report for November.
YoY Measures of Inflation: Services, Goods and Shelter
by Calculated Risk on 1/11/2024 09:00:00 AM
Here are a few measures of inflation:
The first graph is the one Fed Chair Powell had mentioned early last year when services less rent of shelter was up 7.6% year-over-year. This declined sharply and is now up 3.4% YoY.
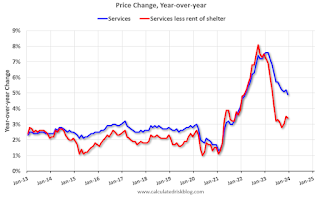
This graph shows the YoY price change for Services and Services less rent of shelter through November 2023.
Services less rent of shelter was up 3.4% YoY in December, down from 3.5% YoY in November.
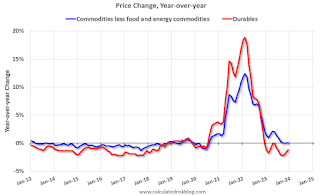 The second graph shows that goods prices started to increase year-over-year (YoY) in 2020 and accelerated in 2021 due to both strong demand and supply chain disruptions.
Commodities less food and energy commodities were at 0.1% YoY in December, up from 0.0% YoY in November.
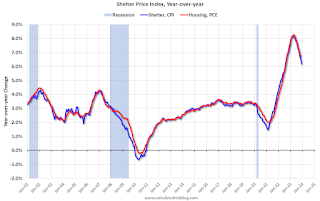 Here is a graph of the year-over-year change in shelter from the CPI report (through December) and housing from the PCE report (through November 2023)
Shelter was up 6.2% year-over-year in December, down from 6.5% in November. Housing (PCE) was up 6.7% YoY in November, down from 6.9% in October.
The BLS noted this morning: "The index for shelter continued to rise in December, contributing over half of the monthly all items increase. "
Core CPI ex-shelter was up 2.2% YoY in December, up from 2.1% in November.
Weekly Initial Unemployment Claims at 202,000
by Calculated Risk on 1/11/2024 08:37:00 AM
The DOL reported:
In the week ending January 6, the advance figure for seasonally adjusted initial claims was 202,000, a decrease of 1,000 from the previous week's revised level. The previous week's level was revised up by 1,000 from 202,000 to 203,000. The 4-week moving average was 207,750, a decrease of 250 from the previous week's revised average. The previous week's average was revised up by 250 from 207,750 to 208,000.The following graph shows the 4-week moving average of weekly claims since 1971.
emphasis added
 Click on graph for larger image.
The dashed line on the graph is the current 4-week average. The four-week average of weekly unemployment claims decreased to 207,750.
The previous week was revised up.
Weekly claims were below the consensus forecast.
BLS: CPI Increased 0.3% in December; Core CPI increased 0.3%
by Calculated Risk on 1/11/2024 08:30:00 AM
The Consumer Price Index for All Urban Consumers (CPI-U) increased 0.3 percent in December on a seasonally adjusted basis, after rising 0.1 percent in November, the U.S. Bureau of Labor Statistics reported today. Over the last 12 months, the all items index increased 3.4 percent before seasonal adjustment.The change in CPI was slightly above expectations and core CPI was at expectations. I'll post a graph later today after the Cleveland Fed releases the median and trimmed-mean CPI.
The index for shelter continued to rise in December, contributing over half of the monthly all items increase. The energy index rose 0.4 percent over the month as increases in the electricity index and the gasoline index more than offset a decrease in the natural gas index. The food index increased 0.2 percent in December, as it did in November. The index for food at home increased 0.1 percent over the month and the index for food away from home rose 0.3 percent.
The index for all items less food and energy rose 0.3 percent in December, the same monthly increase as in November. Indexes which increased in December include shelter, motor vehicle insurance, and medical care. The index for household furnishings and operations and the index for personal care were among those that decreased over the month.
The all items index rose 3.4 percent for the 12 months ending December, a larger increase than the 3.1-percent increase for the 12 months ending November. The all items less food and energy index rose 3.9 percent over the last 12 months, after rising 4.0 percent over the 12 months ending November. The energy index decreased 2.0 percent for the 12 months ending December, while the food index increased 2.7 percent over the last year.
emphasis added
Wednesday, January 10, 2024
Thursday: CPI, Unemployment Claims
by Calculated Risk on 1/10/2024 07:30:00 PM

Thursday:
• At 8:30 AM ET, The initial weekly unemployment claims report will be released. The consensus is for 215 thousand, up from 202 thousand.
• Also at 8:30 AM, The Consumer Price Index for December from the BLS. The consensus is for 0.2% increase in CPI, and a 0.3% increase in core CPI. The consensus is for CPI to be up 3.2% year-over-year and core CPI to be up 3.9% YoY.
Question #1 for 2024: How much will the economy grow in 2024? Will there be a recession in 2024?
by Calculated Risk on 1/10/2024 03:48:00 PM
Earlier I posted some questions on my blog for this year: Ten Economic Questions for 2024. Some of those questions concerned real estate (inventory, house prices, housing starts, new home sales), and I posted thoughts on those in the newsletter (others like GDP and employment are on this blog).
I've added some thoughts and made some predictions for each question.
1) Economic growth: Economic growth was probably close to 2.6% in 2023. The FOMC is expecting growth of 1.2% to 1.7% Q4-over-Q4 in 2024. How much will the economy grow in 2024? Will there be a recession in 2024?
 Here is a graph of 10-Year Treasury Constant Maturity Minus 2-Year Treasury Constant Maturity from FRED since 1976.
 Click here for interactive graph at FRED.
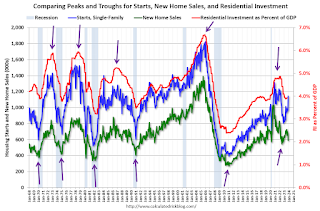 The arrows point to some of the earlier peaks and troughs for these three measures - and the most recent likely bottom.
New home sales and single-family starts turned down in 2022 in response to higher mortgage rates. However, all three measures appear to have bottomed without a recession.
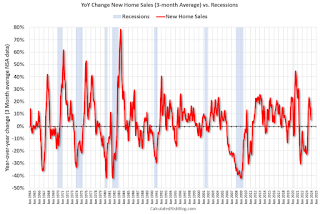 The third graph shows the YoY change in New Home Sales from the Census Bureau. Currently new home sales (based on 3-month average) are up 5% year-over-year.
Here is a table of the annual change in real GDP since 2005. Prior to the pandemic, economic activity was mostly in the 2% range since 2010. Given current demographics, that is about what we'd expect: See: 2% is the new 4%..
Note: This table includes both annual change and q4 over the previous q4 (two slightly different measures). For 2023, I used a 2.6% growth rate Q4 over Q4. (this gives 2.4% real annual growth).
| Real GDP Growth | ||
|---|---|---|
| Year | Annual GDP | Q4 / Q4 |
| 2005 | 3.5% | 3.0% |
| 2006 | 2.8% | 2.6% |
| 2007 | 2.0% | 2.1% |
| 2008 | 0.1% | -2.5% |
| 2009 | -2.6% | 0.1% |
| 2010 | 2.7% | 2.8% |
| 2011 | 1.6% | 1.5% |
| 2012 | 2.3% | 1.6% |
| 2013 | 2.1% | 3.0% |
| 2014 | 2.5% | 2.7% |
| 2015 | 2.9% | 2.1% |
| 2016 | 1.8% | 2.2% |
| 2017 | 2.5% | 3.0% |
| 2018 | 3.0% | 2.1% |
| 2019 | 2.5% | 3.2% |
| 2020 | -2.2% | -1.1% |
| 2021 | 5.8% | 5.4% |
| 2022 | 1.9% | 0.7% |
| 20231 | 2.4% | 2.6% |
| 1 2023 estimate based on 2.6% Q4 SAAR annualized real growth rate. | ||
My sense is growth will be sluggish in 2024, and the economy will avoid recession. Monetary policy is restrictive, but the Fed is expected to cut rates this year. Vehicle sales will probably pick up in 2024, and so will new home sales.
• Question #1 for 2024: How much will the economy grow in 2024? Will there be a recession in 2024?
• Question #2 for 2024: How much will job growth slow in 2024? Or will the economy lose jobs?
• Question #3 for 2024: What will the unemployment rate be in December 2024?
• Question #4 for 2024: What will the participation rate be in December 2024?
• Question #5 for 2024: What will the YoY core inflation rate be in December 2024?
• Question #6 for 2024: What will the Fed Funds rate be in December 2024?
• Question #7 for 2024: How much will wages increase in 2024?
• Question #8 for 2024: How much will Residential investment change in 2024? How about housing starts and new home sales in 2024?
• Question #9 for 2024: What will happen with house prices in 2024?
• Question #10 for 2024: Will inventory increase further in 2024?
Part 1: Current State of the Housing Market; Overview for mid-January 2024
by Calculated Risk on 1/10/2024 12:32:00 PM
Today, in the Calculated Risk Real Estate Newsletter: Part 1: Current State of the Housing Market; Overview for mid-January 2024
A brief excerpt:
This 2-part overview for mid-January provides a snapshot of the current housing market. This includes sales, house prices, inventory, mortgage rates, rents and more.There is much more in the article.
I always like to start with inventory, since inventory usually tells the tale!
...
Here is a graph of new listing from Realtor.com’s December 2023 Monthly Housing Market Trends Report showing new listings were up 9.1% year-over-year in December. New listings finished 2023 up year-over-year mostly because new listings collapsed in the 2nd half of 2022. From Realtor.com:
Providing a boost to overall inventory, sellers turned out in higher numbers this December as newly listed homes were 9.1% above last year’s levels. This marked the second month of increasing listing activity after a 17-month streak of decline.Note the seasonality for new listings. December and January are seasonally the weakest months of the year for new listings. It seems very likely that new listings will be up year-over-year in 2024, but we will have to wait for the March data to see how close new listings are to normal levels.
Leading Index for Commercial Real Estate Increased in December, Down 11% from Peak
by Calculated Risk on 1/10/2024 11:52:00 AM
From Dodge Data Analytics: Dodge Momentum Index Improves 3% in December
The Dodge Momentum Index (DMI), issued by Dodge Construction Network (DCN), rose 3% in December to 186.6 (2000=100) from the revised November reading of 181.5. Over the month, commercial planning grew 1.0% and institutional planning improved 6.1%.
“The Momentum Index ended the year 11% below the November 2022 peak, ultimately stabilizing as the year progressed. Regardless, the DMI averaged a reading of 184.3 in 2023, hitting levels of activity that haven’t been recorded since 2008,” stated Sarah Martin, associate director of forecasting for DCN. “While ongoing labor and construction cost issues will persist in 2024, a substantive amount of projects are sitting in the planning queue and will support construction spending going into 2025.”
...
The DMI is a monthly measure of the value of nonresidential building projects going into planning, shown to lead construction spending for nonresidential buildings by a full year.
emphasis added
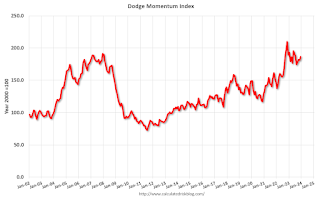 Click on graph for larger image.
This graph shows the Dodge Momentum Index since 2002. The index was at 186.6 in December, up from 181.5 the previous month.
According to Dodge, this index leads "construction spending for nonresidential buildings by a full year". This index suggests some slowdown in 2024.
Question #2 for 2024: How much will job growth slow in 2024? Or will the economy lose jobs?
by Calculated Risk on 1/10/2024 09:47:00 AM
Earlier I posted some questions on my blog for next year: Ten Economic Questions for 2024. Some of these questions concern real estate (inventory, house prices, housing starts, new home sales), and I’ll post thoughts on those in the newsletter (others like GDP and employment will be on this blog).
I'm adding some thoughts, and maybe some predictions for each question.
2) Employment: Through November 2023, the economy added 2.6 million jobs in 2023. This is down from 4.8 million jobs added in 2022, and 7.3 million in 2021 (the two best years ever), but still a solid year for employment gains. How much will job growth slow in 2024? Or will the economy lose jobs?
| Change in Payroll Jobs per Year (000s) | |||
|---|---|---|---|
| Total, Nonfarm | Private | Public | |
| 1997 | 3,406 | 3,211 | 195 |
| 1998 | 3,048 | 2,735 | 313 |
| 1999 | 3,181 | 2,720 | 461 |
| 2000 | 1,938 | 1,674 | 264 |
| 2001 | -1,733 | -2,284 | 551 |
| 2002 | -515 | -748 | 233 |
| 2003 | 125 | 167 | -42 |
| 2004 | 2,038 | 1,891 | 147 |
| 2005 | 2,528 | 2,342 | 186 |
| 2006 | 2,092 | 1,883 | 209 |
| 2007 | 1,145 | 857 | 288 |
| 2008 | -3,549 | -3,729 | 180 |
| 2009 | -5,041 | -4,967 | -74 |
| 2010 | 1,027 | 1,243 | -216 |
| 2011 | 2,066 | 2,378 | -312 |
| 2012 | 2,174 | 2,241 | -67 |
| 2013 | 2,293 | 2,360 | -67 |
| 2014 | 2,998 | 2,871 | 127 |
| 2015 | 2,717 | 2,567 | 150 |
| 2016 | 2,325 | 2,118 | 207 |
| 2017 | 2,113 | 2,033 | 80 |
| 2018 | 2,284 | 2,157 | 127 |
| 2019 | 1,959 | 1,747 | 212 |
| 2020 | -9,289 | -8,237 | -1,052 |
| 2021 | 7,267 | 6,882 | 385 |
| 2022 | 4,793 | 4,518 | 275 |
| 2023 | 2,697 | 2,025 | 672 |
The good news is job market still has momentum heading into 2024.
 Click on graph for larger image.
The bad news - for job growth - is that a combination of a slowing economy, demographics and a labor market near full employment suggests fewer jobs will be added in 2024.
| Construction Jobs (000s) | Manufacturing (000s) | |
|---|---|---|
| 2006 | 152 | -178 |
| 2007 | -195 | -269 |
| 2008 | -789 | -896 |
| 2009 | -1,047 | -1,375 |
| 2010 | -187 | 120 |
| 2011 | 144 | 207 |
| 2012 | 113 | 158 |
| 2013 | 208 | 123 |
| 2014 | 361 | 209 |
| 2015 | 337 | 70 |
| 2016 | 188 | -7 |
| 2017 | 273 | 178 |
| 2018 | 305 | 263 |
| 2019 | 132 | 5 |
| 2020 | -173 | -602 |
| 2021 | 239 | 385 |
| 2022 | 265 | 390 |
| 2023 | 197 | 12 |
For manufacturing, there will probably be some growth in the auto sector in 2024, and possibly in other manufacturing sectors. However, for construction, multi-family construction will slow in 2024, and so will several commercial real estate sectors (based on both the Architecture Billings Index and the Dodge Momentum Index.
So, my forecast is for gains of around 1.0 million to 1.5 million jobs in 2024. This would be another solid year for employment gains given current demographics.
• Question #1 for 2024: How much will the economy grow in 2024? Will there be a recession in 2024?
• Question #2 for 2024: How much will job growth slow in 2024? Or will the economy lose jobs?
• Question #3 for 2024: What will the unemployment rate be in December 2024?
• Question #4 for 2024: What will the participation rate be in December 2024?
• Question #5 for 2024: What will the YoY core inflation rate be in December 2024?
• Question #6 for 2024: What will the Fed Funds rate be in December 2024?
• Question #7 for 2024: How much will wages increase in 2024?
• Question #8 for 2024: How much will Residential investment change in 2024? How about housing starts and new home sales in 2024?
• Question #9 for 2024: What will happen with house prices in 2024?
• Question #10 for 2024: Will inventory increase further in 2024?


