 RSS Feed
 by Calculated Risk on 1/12/2024 09:52:00 AM
Friday, January 12, 2024
2nd Look at Local Housing Markets in December
Today, in the Calculated Risk Real Estate Newsletter: 2nd Look at Local Housing Markets in December
A brief excerpt:
NOTE: The tables for active listings, new listings and closed sales all include a comparison to December 2019 for each local market (some 2019 data is not available).There is much more in the article.
This is the second look at several early reporting local markets in December. I’m tracking about 40 local housing markets in the US. Some of the 40 markets are states, and some are metropolitan areas. I’ll update these tables throughout the month as additional data is released.
Closed sales in December were mostly for contracts signed in October and November.
...
And a table of December sales.
In December, sales in these markets were down 6.8%. In November, these same markets were down 5.2% YoY Not Seasonally Adjusted (NSA).
Sales in almost all of these markets are down sharply compared to December 2019.
...
It appears annual sales for 2023 will be at the lowest level since 1995.
Many more local markets to come!

AAR: December Carloads and Intermodal Up YoY
by Calculated Risk on 1/12/2024 08:11:00 AM
From the Association of American Railroads (AAR) Rail Time Indicators. Graphs and excerpts reprinted with permission.
U.S. railroads originated 11.70 million total carloads in 2023 — up 0.7% (81,504 carloads) over 2022, up 0.7% (78,633 carloads) over 2021, and the most for a full year since 2019.
For all of 2023, U.S. intermodal originations totaled 12.67 million containers and trailers — down 4.9% (657,165 units) from 2022, down 9.6% (1.35 million) from 2021, and the lowest annual volume since 2013. In 2023, containers were 94.9% of U.S. intermodal units, a record high.
2023 is only the second year in our records (1996 was the other) in which total carloads were up over the previous year but intermodal was down.
emphasis added
 Click on graph for larger image.
This graph from the Rail Time Indicators report shows the six-week average of U.S. Carloads in 2021, 2022 and 2023:
Total carloads in December 2023 were up 7.3% over December 2022, the biggest year-over-year monthly percentage gain since February 2022. Total carloads were up 2.0% in Q4 2023 over Q4 2022, their best year-over-year quarterly percentage gain since Q1 2022.
 The second graph shows the six-week average (not monthly) of U.S. intermodal in 2021, 2022 and 2023: (using intermodal or shipping containers):
In December 2023, U.S. intermodal volume was up 10.2% over December 2022, intermodal’s biggest monthly year-over-year percentage gain since June 2021. Intermodal was up 5.5% in Q4 2023 over Q4 2022, its biggest quarterly gain since Q2 2021.
Thursday, January 11, 2024
Friday: PPI
by Calculated Risk on 1/11/2024 07:33:00 PM
 Note: Mortgage rates are from MortgageNewsDaily.com and are for top tier scenarios.
Friday:
• At 8:30 AM ET, The Producer Price Index for December from the BLS. The consensus is for a 0.1% increase in PPI, and a 0.2% increase in core PPI.
Cleveland Fed: Median CPI increased 0.4% and Trimmed-mean CPI increased 0.3% in December
by Calculated Risk on 1/11/2024 02:59:00 PM
The Cleveland Fed released the median CPI and the trimmed-mean CPI.
According to the Federal Reserve Bank of Cleveland, the median Consumer Price Index rose 0.4% in December. The 16% trimmed-mean Consumer Price Index increased 0.3% in November. "The median CPI and 16% trimmed-mean CPI are measures of core inflation calculated by the Federal Reserve Bank of Cleveland based on data released in the Bureau of Labor Statistics’ (BLS) monthly CPI report".
 Click on graph for larger image.
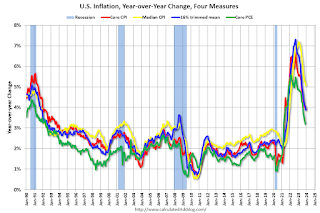
This graph shows the year-over-year change for these four key measures of inflation.
Note: The Cleveland Fed released the median CPI details. "Fuel oil and other fuels" decreased at a 33% annualized rate in December.
According to the Federal Reserve Bank of Cleveland, the median Consumer Price Index rose 0.4% in December. The 16% trimmed-mean Consumer Price Index increased 0.3% in November. "The median CPI and 16% trimmed-mean CPI are measures of core inflation calculated by the Federal Reserve Bank of Cleveland based on data released in the Bureau of Labor Statistics’ (BLS) monthly CPI report".
 Click on graph for larger image.
This graph shows the year-over-year change for these four key measures of inflation.
On a year-over-year basis, the median CPI rose 5.1% (down from 5.2% in November), the trimmed-mean CPI rose 3.9% (down from 4.0%), and the CPI less food and energy rose 3.9% (down from 4.0%).
Core PCE is for November was up 3.2% YoY, down from 3.4% in October.
Note: The Cleveland Fed released the median CPI details. "Fuel oil and other fuels" decreased at a 33% annualized rate in December.
Rent and Owner's equivalent rent are still very high, and if we exclude rent, median CPI would be close to 3.3% (well below 5.1%).
Part 2: Current State of the Housing Market; Overview for mid-January 2024
by Calculated Risk on 1/11/2024 11:53:00 AM
Today, in the Calculated Risk Real Estate Newsletter: Part 2: Current State of the Housing Market; Overview for mid-January 2024
A brief excerpt:
“If you do not know where you come from, then you don't know where you are, and if you don't know where you are, then you don't know where you're going. And if you don't know where you're going, you're probably going wrong.” Terry PratchettThere is much more in the article.
These “Current State” summaries show us where we came from, where we are, and hopefully give us clues as to where we are going!
Yesterday, in Part 1: Current State of the Housing Market; Overview for mid-January 2024 I reviewed home inventory and sales.
...
Other measures of house prices suggest prices will be up further YoY in the November Case-Shiller index. The NAR reported median prices were up 4.0% YoY in November, up from 3.4% YoY in October. ICE / Black Knight reported prices were up 5.1% YoY in November, up from 4.5% YoY in October to new all-time highs, and Freddie Mac reported house prices were up 6.3% YoY in November, up from 5.6% YoY in October - and also to new all-time highs.
Here is a comparison of year-over-year change in the FMHPI, median house prices from the NAR, and the Case-Shiller National index.
The FMHPI and the NAR median prices appear to be leading indicators for Case-Shiller. Based on recent monthly data, and the FMHPI, the YoY change in the Case-Shiller index will increase further in the report for November.

YoY Measures of Inflation: Services, Goods and Shelter
by Calculated Risk on 1/11/2024 09:00:00 AM
Here are a few measures of inflation:
The first graph is the one Fed Chair Powell had mentioned early last year when services less rent of shelter was up 7.6% year-over-year. This declined sharply and is now up 3.4% YoY.
 Click on graph for larger image.
This graph shows the YoY price change for Services and Services less rent of shelter through November 2023.
Services were up 4.9% YoY as of December 2023, down from 5.2% YoY in November.
Services less rent of shelter was up 3.4% YoY in December, down from 3.5% YoY in November.
Services less rent of shelter was up 3.4% YoY in December, down from 3.5% YoY in November.
 The second graph shows that goods prices started to increase year-over-year (YoY) in 2020 and accelerated in 2021 due to both strong demand and supply chain disruptions.
Durables were at -1.2% YoY as of December 2023, up from -1.6% YoY in November.
Commodities less food and energy commodities were at 0.1% YoY in December, up from 0.0% YoY in November.
Commodities less food and energy commodities were at 0.1% YoY in December, up from 0.0% YoY in November.
Goods inflation was transitory.
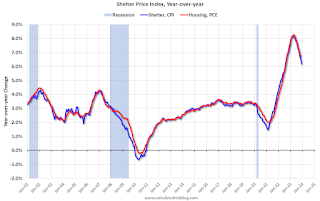 Here is a graph of the year-over-year change in shelter from the CPI report (through December) and housing from the PCE report (through November 2023)
Shelter was up 6.2% year-over-year in December, down from 6.5% in November. Housing (PCE) was up 6.7% YoY in November, down from 6.9% in October.
 Here is a graph of the year-over-year change in shelter from the CPI report (through December) and housing from the PCE report (through November 2023)
Shelter was up 6.2% year-over-year in December, down from 6.5% in November. Housing (PCE) was up 6.7% YoY in November, down from 6.9% in October.
This is still catching up with private data. Moody's just reported that effective rents were down YoY: "At the national level, asking rent was down to $1,825 while effective rent closed at $1,732, 0.8% and 1.7% lower than their respective year-ago levels."
The BLS noted this morning: "The index for shelter continued to rise in December, contributing over half of the monthly all items increase. "
Core CPI ex-shelter was up 2.2% YoY in December, up from 2.1% in November.
Weekly Initial Unemployment Claims at 202,000
by Calculated Risk on 1/11/2024 08:37:00 AM
The DOL reported:
In the week ending January 6, the advance figure for seasonally adjusted initial claims was 202,000, a decrease of 1,000 from the previous week's revised level. The previous week's level was revised up by 1,000 from 202,000 to 203,000. The 4-week moving average was 207,750, a decrease of 250 from the previous week's revised average. The previous week's average was revised up by 250 from 207,750 to 208,000.The following graph shows the 4-week moving average of weekly claims since 1971.
emphasis added
 Click on graph for larger image.
The dashed line on the graph is the current 4-week average. The four-week average of weekly unemployment claims decreased to 207,750.
The previous week was revised up.
Weekly claims were below the consensus forecast.
BLS: CPI Increased 0.3% in December; Core CPI increased 0.3%
by Calculated Risk on 1/11/2024 08:30:00 AM
The Consumer Price Index for All Urban Consumers (CPI-U) increased 0.3 percent in December on a seasonally adjusted basis, after rising 0.1 percent in November, the U.S. Bureau of Labor Statistics reported today. Over the last 12 months, the all items index increased 3.4 percent before seasonal adjustment.The change in CPI was slightly above expectations and core CPI was at expectations. I'll post a graph later today after the Cleveland Fed releases the median and trimmed-mean CPI.
The index for shelter continued to rise in December, contributing over half of the monthly all items increase. The energy index rose 0.4 percent over the month as increases in the electricity index and the gasoline index more than offset a decrease in the natural gas index. The food index increased 0.2 percent in December, as it did in November. The index for food at home increased 0.1 percent over the month and the index for food away from home rose 0.3 percent.
The index for all items less food and energy rose 0.3 percent in December, the same monthly increase as in November. Indexes which increased in December include shelter, motor vehicle insurance, and medical care. The index for household furnishings and operations and the index for personal care were among those that decreased over the month.
The all items index rose 3.4 percent for the 12 months ending December, a larger increase than the 3.1-percent increase for the 12 months ending November. The all items less food and energy index rose 3.9 percent over the last 12 months, after rising 4.0 percent over the 12 months ending November. The energy index decreased 2.0 percent for the 12 months ending December, while the food index increased 2.7 percent over the last year.
emphasis added
Wednesday, January 10, 2024
Thursday: CPI, Unemployment Claims
by Calculated Risk on 1/10/2024 07:30:00 PM
 Note: Mortgage rates are from MortgageNewsDaily.com and are for top tier scenarios.
Thursday:
• At 8:30 AM ET, The initial weekly unemployment claims report will be released. The consensus is for 215 thousand, up from 202 thousand.
• Also at 8:30 AM, The Consumer Price Index for December from the BLS. The consensus is for 0.2% increase in CPI, and a 0.3% increase in core CPI. The consensus is for CPI to be up 3.2% year-over-year and core CPI to be up 3.9% YoY.
Question #1 for 2024: How much will the economy grow in 2024? Will there be a recession in 2024?
by Calculated Risk on 1/10/2024 03:48:00 PM
Earlier I posted some questions on my blog for this year: Ten Economic Questions for 2024. Some of those questions concerned real estate (inventory, house prices, housing starts, new home sales), and I posted thoughts on those in the newsletter (others like GDP and employment are on this blog).
I've added some thoughts and made some predictions for each question.
1) Economic growth: Economic growth was probably close to 2.6% in 2023. The FOMC is expecting growth of 1.2% to 1.7% Q4-over-Q4 in 2024. How much will the economy grow in 2024? Will there be a recession in 2024?
A year ago, I argued that "the economy will avoid recession" in 2023, even though some key indicators suggested a possible recession, the FOMC was forecasting an employment recession, and many Wall Street analysts were forecasting an economic recession.
It is satisfying to make an out of consensus forecast, and get it mostly correct. But we are not out of the woods yet. Recessions can be the result of exogenous events, like the pandemic or the oil shocks due to geopolitical issues in the 1970s, the bursting of speculative bubbles like in 2001 (stock) or 2007 (housing), or - most frequently - the Fed tightening monetary policy to slow inflation.
Exogenous events are always a threat, and there are several geopolitical issues that could lead to recession - in Ukraine, the Middle East, and even with China. However, none of those risks appear likely to cause a U.S. recession this year.
But there is a risk that the Fed will be overly tight in 2024. The "Art of the Soft Landing" requires that the Fed reduce rates quick enough to keep economic growth positive, and slow enough not to reignite inflation. That seems very possible.
My view is a soft landing is achieved if growth stays positive, inflation returns to target, and the yield curve flattens or reverts to normal (long yields higher than short yields.
 Here is a graph of 10-Year Treasury Constant Maturity Minus 2-Year Treasury Constant Maturity from FRED since 1976.
 Note that recessions usually happen after the yield curve reverts. However, this time, inflation was driven by pandemic economics (supply shocks, etc), and it seems likely the yield curve will revert without a recession.
Click here for interactive graph at FRED.
Click here for interactive graph at FRED.
One of my favorite models for business cycle forecasting uses new home sales (also housing starts and residential investment). The purpose of the next graph is to show that these three indicators generally reach peaks and troughs together. Note that Residential Investment is quarterly and single-family starts and new home sales are monthly.
 The arrows point to some of the earlier peaks and troughs for these three measures - and the most recent likely bottom.
New home sales and single-family starts turned down in 2022 in response to higher mortgage rates. However, all three measures appear to have bottomed without a recession.
 The third graph shows the YoY change in New Home Sales from the Census Bureau. Currently new home sales (based on 3-month average) are up 5% year-over-year.
Usually when the YoY change in New Home Sales falls about 20%, a recession will follow. An exception for this data series was the mid '60s when the Vietnam buildup kept the economy out of recession. Another exception was in late 2021 - we saw a significant YoY decline in new home sales related to the pandemic and the surge in new home sales in the second half of 2020. I ignored that pandemic distortion. Also note that the sharp decline in 2010 was related to the housing tax credit policy in 2009 - and was just a continuation of the housing bust.
IMPORTANT: These business cycle models (yield curve, housing) are very useful, but I'm not a slave to any model!
Here is a table of the annual change in real GDP since 2005. Prior to the pandemic, economic activity was mostly in the 2% range since 2010. Given current demographics, that is about what we'd expect: See: 2% is the new 4%..
Note: This table includes both annual change and q4 over the previous q4 (two slightly different measures). For 2023, I used a 2.6% growth rate Q4 over Q4. (this gives 2.4% real annual growth).
My sense is growth will be sluggish in 2024, and the economy will avoid recession. Monetary policy is restrictive, but the Fed is expected to cut rates this year. Vehicle sales will probably pick up in 2024, and so will new home sales.
Here is a table of the annual change in real GDP since 2005. Prior to the pandemic, economic activity was mostly in the 2% range since 2010. Given current demographics, that is about what we'd expect: See: 2% is the new 4%..
Note: This table includes both annual change and q4 over the previous q4 (two slightly different measures). For 2023, I used a 2.6% growth rate Q4 over Q4. (this gives 2.4% real annual growth).
| Real GDP Growth | ||
|---|---|---|
| Year | Annual GDP | Q4 / Q4 |
| 2005 | 3.5% | 3.0% |
| 2006 | 2.8% | 2.6% |
| 2007 | 2.0% | 2.1% |
| 2008 | 0.1% | -2.5% |
| 2009 | -2.6% | 0.1% |
| 2010 | 2.7% | 2.8% |
| 2011 | 1.6% | 1.5% |
| 2012 | 2.3% | 1.6% |
| 2013 | 2.1% | 3.0% |
| 2014 | 2.5% | 2.7% |
| 2015 | 2.9% | 2.1% |
| 2016 | 1.8% | 2.2% |
| 2017 | 2.5% | 3.0% |
| 2018 | 3.0% | 2.1% |
| 2019 | 2.5% | 3.2% |
| 2020 | -2.2% | -1.1% |
| 2021 | 5.8% | 5.4% |
| 2022 | 1.9% | 0.7% |
| 20231 | 2.4% | 2.6% |
| 1 2023 estimate based on 2.6% Q4 SAAR annualized real growth rate. | ||
My sense is growth will be sluggish in 2024, and the economy will avoid recession. Monetary policy is restrictive, but the Fed is expected to cut rates this year. Vehicle sales will probably pick up in 2024, and so will new home sales.
So, my guess is that real GDP growth will be positive in the 1% to 2% range in 2024.
• Question #1 for 2024: How much will the economy grow in 2024? Will there be a recession in 2024?
• Question #2 for 2024: How much will job growth slow in 2024? Or will the economy lose jobs?
• Question #3 for 2024: What will the unemployment rate be in December 2024?
• Question #4 for 2024: What will the participation rate be in December 2024?
• Question #5 for 2024: What will the YoY core inflation rate be in December 2024?
• Question #6 for 2024: What will the Fed Funds rate be in December 2024?
• Question #7 for 2024: How much will wages increase in 2024?
• Question #8 for 2024: How much will Residential investment change in 2024? How about housing starts and new home sales in 2024?
• Question #9 for 2024: What will happen with house prices in 2024?
• Question #10 for 2024: Will inventory increase further in 2024?


