 RSS Feed
 by Calculated Risk on 1/13/2024 08:11:00 AM
Saturday, January 13, 2024
Schedule for Week of January 14, 2024
The key reports this week are December retail sales, housing starts and existing home sales.
For manufacturing, the December Industrial Production report and the January New York and Philly Fed manufacturing surveys will be released.
All US markets will be closed in observance of Martin Luther King Jr. Day
8:30 AM: The New York Fed Empire State manufacturing survey for January. The consensus is for a reading of -7.1, up from -14.5.
7:00 AM ET: The Mortgage Bankers Association (MBA) will release the results for the mortgage purchase applications index.
 8:30 AM: Retail sales for December is scheduled to be released. The consensus is for a 0.3% increase in retail sales.
This graph shows retail sales since 1992. This is monthly retail sales and food service, seasonally adjusted (total and ex-gasoline).
 9:15 AM: The Fed will release Industrial Production and Capacity Utilization for December.
This graph shows industrial production since 1967.
The consensus is for a 0.1% decrease in Industrial Production, and for Capacity Utilization to decrease to 78.6%.
10:00 AM: The January NAHB homebuilder survey. The consensus is for a reading of 38, up from 37 in December. Any number below 50 indicates that more builders view sales conditions as poor than good.
2:00 PM: the Federal Reserve Beige Book, an informal review by the Federal Reserve Banks of current economic conditions in their Districts.
8:30 AM: The initial weekly unemployment claims report will be released. The consensus is for 204 thousand, up from 202 thousand.
 8:30 AM: Housing Starts for December.
 This graph shows single and multi-family housing starts since 1968.
The consensus is for 1.415 million SAAR, down from 1.560 million SAAR.
8:30 AM: the Philly Fed manufacturing survey for January.
 10:00 AM: Existing Home Sales for December from the National Association of Realtors (NAR). The consensus is for 3.84 million SAAR, up from 3.82 million.
The graph shows existing home sales from 1994 through the report last month.
10:00 AM: University of Michigan's Consumer sentiment index (Preliminary for January).
Friday, January 12, 2024
Jan 12th COVID Update: Hospitalizations Increased
by Calculated Risk on 1/12/2024 07:54:00 PM
 Note: Mortgage rates are from MortgageNewsDaily.com and are for top tier scenarios.
Due to changes at the CDC, weekly cases are no longer updated.
For deaths, I'm currently using 4 weeks ago for "now", since the most recent three weeks will be revised significantly.
Hospitalizations have almost sextupled from a low of 5,150 in June 2023.
Hospitalizations are about 20% of the peak of 150,000 in January 2022.
| COVID Metrics | ||||
|---|---|---|---|---|
| Now | Week Ago | Goal | ||
| Hospitalized2🚩 | 29,285 | 26,079 | ≤3,0001 | |
| Deaths per Week2 | 1,500 | 1,689 | ≤3501 | |
| 1my goals to stop weekly posts, 2Weekly for Currently Hospitalized, and Deaths 🚩 Increasing number weekly for Hospitalized and Deaths ✅ Goal met. | ||||
 Click on graph for larger image.
This graph shows the weekly (columns) number of deaths reported.
Weekly deaths have more than tripled from a low of 485 in early July. Still weekly deaths are far below the weekly peak of 26,000 in January 2021.
And here is a new graph I'm following on COVID in wastewater as of Jan 11th:
 This appears to be a leading indicator for COVID hospitalizations and deaths.
COVID in wastewater might have peaked at the highest level since January 2022 (about half that peak).
Q4 GDP Tracking: 1.3% to 2.2% Range
by Calculated Risk on 1/12/2024 01:00:00 PM
From BofA:
Overall, since our last weekly publication, our 4Q US GDP tracking estimate is up two-tenths to 1.3% q/q saar, while 3Q GDP finalized at 4.9% q/q saar in the third estimate. [Jan 12th estimate]From Goldman:
emphasis added
We left our Q4 GDP tracking estimate unchanged at +1.5% (qoq ar) and our Q4 domestic final sales growth forecast unchanged at +2.2% (qoq ar). [Jan 10th estimate]And from the Altanta Fed: GDPNow
The GDPNow model estimate for real GDP growth (seasonally adjusted annual rate) in the fourth quarter of 2023 is 2.2 percent on January 10, unchanged from January 9 after rounding. [Jan 10th estimate]
2nd Look at Local Housing Markets in December
by Calculated Risk on 1/12/2024 09:52:00 AM
Today, in the Calculated Risk Real Estate Newsletter: 2nd Look at Local Housing Markets in December
A brief excerpt:
NOTE: The tables for active listings, new listings and closed sales all include a comparison to December 2019 for each local market (some 2019 data is not available).There is much more in the article.
This is the second look at several early reporting local markets in December. I’m tracking about 40 local housing markets in the US. Some of the 40 markets are states, and some are metropolitan areas. I’ll update these tables throughout the month as additional data is released.
Closed sales in December were mostly for contracts signed in October and November.
...
And a table of December sales.
In December, sales in these markets were down 6.8%. In November, these same markets were down 5.2% YoY Not Seasonally Adjusted (NSA).
Sales in almost all of these markets are down sharply compared to December 2019.
...
It appears annual sales for 2023 will be at the lowest level since 1995.
Many more local markets to come!

AAR: December Carloads and Intermodal Up YoY
by Calculated Risk on 1/12/2024 08:11:00 AM
From the Association of American Railroads (AAR) Rail Time Indicators. Graphs and excerpts reprinted with permission.
U.S. railroads originated 11.70 million total carloads in 2023 — up 0.7% (81,504 carloads) over 2022, up 0.7% (78,633 carloads) over 2021, and the most for a full year since 2019.
For all of 2023, U.S. intermodal originations totaled 12.67 million containers and trailers — down 4.9% (657,165 units) from 2022, down 9.6% (1.35 million) from 2021, and the lowest annual volume since 2013. In 2023, containers were 94.9% of U.S. intermodal units, a record high.
2023 is only the second year in our records (1996 was the other) in which total carloads were up over the previous year but intermodal was down.
emphasis added
 Click on graph for larger image.
This graph from the Rail Time Indicators report shows the six-week average of U.S. Carloads in 2021, 2022 and 2023:
Total carloads in December 2023 were up 7.3% over December 2022, the biggest year-over-year monthly percentage gain since February 2022. Total carloads were up 2.0% in Q4 2023 over Q4 2022, their best year-over-year quarterly percentage gain since Q1 2022.
 The second graph shows the six-week average (not monthly) of U.S. intermodal in 2021, 2022 and 2023: (using intermodal or shipping containers):
In December 2023, U.S. intermodal volume was up 10.2% over December 2022, intermodal’s biggest monthly year-over-year percentage gain since June 2021. Intermodal was up 5.5% in Q4 2023 over Q4 2022, its biggest quarterly gain since Q2 2021.
Thursday, January 11, 2024
Friday: PPI
by Calculated Risk on 1/11/2024 07:33:00 PM
 Note: Mortgage rates are from MortgageNewsDaily.com and are for top tier scenarios.
Friday:
• At 8:30 AM ET, The Producer Price Index for December from the BLS. The consensus is for a 0.1% increase in PPI, and a 0.2% increase in core PPI.
Cleveland Fed: Median CPI increased 0.4% and Trimmed-mean CPI increased 0.3% in December
by Calculated Risk on 1/11/2024 02:59:00 PM
The Cleveland Fed released the median CPI and the trimmed-mean CPI.
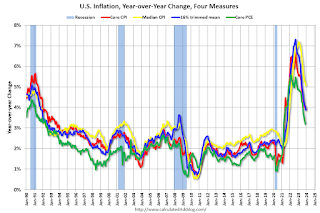
According to the Federal Reserve Bank of Cleveland, the median Consumer Price Index rose 0.4% in December. The 16% trimmed-mean Consumer Price Index increased 0.3% in November. "The median CPI and 16% trimmed-mean CPI are measures of core inflation calculated by the Federal Reserve Bank of Cleveland based on data released in the Bureau of Labor Statistics’ (BLS) monthly CPI report".
 Click on graph for larger image.
This graph shows the year-over-year change for these four key measures of inflation.
Note: The Cleveland Fed released the median CPI details. "Fuel oil and other fuels" decreased at a 33% annualized rate in December.
According to the Federal Reserve Bank of Cleveland, the median Consumer Price Index rose 0.4% in December. The 16% trimmed-mean Consumer Price Index increased 0.3% in November. "The median CPI and 16% trimmed-mean CPI are measures of core inflation calculated by the Federal Reserve Bank of Cleveland based on data released in the Bureau of Labor Statistics’ (BLS) monthly CPI report".
 Click on graph for larger image.
This graph shows the year-over-year change for these four key measures of inflation.
On a year-over-year basis, the median CPI rose 5.1% (down from 5.2% in November), the trimmed-mean CPI rose 3.9% (down from 4.0%), and the CPI less food and energy rose 3.9% (down from 4.0%).
Core PCE is for November was up 3.2% YoY, down from 3.4% in October.
Note: The Cleveland Fed released the median CPI details. "Fuel oil and other fuels" decreased at a 33% annualized rate in December.
Rent and Owner's equivalent rent are still very high, and if we exclude rent, median CPI would be close to 3.3% (well below 5.1%).
Part 2: Current State of the Housing Market; Overview for mid-January 2024
by Calculated Risk on 1/11/2024 11:53:00 AM
Today, in the Calculated Risk Real Estate Newsletter: Part 2: Current State of the Housing Market; Overview for mid-January 2024
A brief excerpt:
“If you do not know where you come from, then you don't know where you are, and if you don't know where you are, then you don't know where you're going. And if you don't know where you're going, you're probably going wrong.” Terry PratchettThere is much more in the article.
These “Current State” summaries show us where we came from, where we are, and hopefully give us clues as to where we are going!
Yesterday, in Part 1: Current State of the Housing Market; Overview for mid-January 2024 I reviewed home inventory and sales.
...
Other measures of house prices suggest prices will be up further YoY in the November Case-Shiller index. The NAR reported median prices were up 4.0% YoY in November, up from 3.4% YoY in October. ICE / Black Knight reported prices were up 5.1% YoY in November, up from 4.5% YoY in October to new all-time highs, and Freddie Mac reported house prices were up 6.3% YoY in November, up from 5.6% YoY in October - and also to new all-time highs.
Here is a comparison of year-over-year change in the FMHPI, median house prices from the NAR, and the Case-Shiller National index.
The FMHPI and the NAR median prices appear to be leading indicators for Case-Shiller. Based on recent monthly data, and the FMHPI, the YoY change in the Case-Shiller index will increase further in the report for November.

YoY Measures of Inflation: Services, Goods and Shelter
by Calculated Risk on 1/11/2024 09:00:00 AM
Here are a few measures of inflation:
The first graph is the one Fed Chair Powell had mentioned early last year when services less rent of shelter was up 7.6% year-over-year. This declined sharply and is now up 3.4% YoY.
 Click on graph for larger image.
This graph shows the YoY price change for Services and Services less rent of shelter through November 2023.
Services were up 4.9% YoY as of December 2023, down from 5.2% YoY in November.
Services less rent of shelter was up 3.4% YoY in December, down from 3.5% YoY in November.
Services less rent of shelter was up 3.4% YoY in December, down from 3.5% YoY in November.
 The second graph shows that goods prices started to increase year-over-year (YoY) in 2020 and accelerated in 2021 due to both strong demand and supply chain disruptions.
Durables were at -1.2% YoY as of December 2023, up from -1.6% YoY in November.
Commodities less food and energy commodities were at 0.1% YoY in December, up from 0.0% YoY in November.
Commodities less food and energy commodities were at 0.1% YoY in December, up from 0.0% YoY in November.
Goods inflation was transitory.
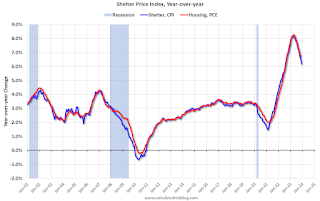 Here is a graph of the year-over-year change in shelter from the CPI report (through December) and housing from the PCE report (through November 2023)
Shelter was up 6.2% year-over-year in December, down from 6.5% in November. Housing (PCE) was up 6.7% YoY in November, down from 6.9% in October.
 Here is a graph of the year-over-year change in shelter from the CPI report (through December) and housing from the PCE report (through November 2023)
Shelter was up 6.2% year-over-year in December, down from 6.5% in November. Housing (PCE) was up 6.7% YoY in November, down from 6.9% in October.
This is still catching up with private data. Moody's just reported that effective rents were down YoY: "At the national level, asking rent was down to $1,825 while effective rent closed at $1,732, 0.8% and 1.7% lower than their respective year-ago levels."
The BLS noted this morning: "The index for shelter continued to rise in December, contributing over half of the monthly all items increase. "
Core CPI ex-shelter was up 2.2% YoY in December, up from 2.1% in November.
Weekly Initial Unemployment Claims at 202,000
by Calculated Risk on 1/11/2024 08:37:00 AM
The DOL reported:
In the week ending January 6, the advance figure for seasonally adjusted initial claims was 202,000, a decrease of 1,000 from the previous week's revised level. The previous week's level was revised up by 1,000 from 202,000 to 203,000. The 4-week moving average was 207,750, a decrease of 250 from the previous week's revised average. The previous week's average was revised up by 250 from 207,750 to 208,000.The following graph shows the 4-week moving average of weekly claims since 1971.
emphasis added
 Click on graph for larger image.
The dashed line on the graph is the current 4-week average. The four-week average of weekly unemployment claims decreased to 207,750.
The previous week was revised up.
Weekly claims were below the consensus forecast.


