by Calculated Risk on 1/16/2024 12:59:00 PM
Tuesday, January 16, 2024
3rd Look at Local Housing Markets in December
Today, in the Calculated Risk Real Estate Newsletter: 3rd Look at Local Housing Markets in December
A brief excerpt:
NOTE: The tables for active listings, new listings and closed sales all include a comparison to December 2019 for each local market (some 2019 data is not available).There is much more in the article.
This is the third look at several local markets in December. I’m tracking about 40 local housing markets in the US. Some of the 40 markets are states, and some are metropolitan areas. I’ll update these tables throughout the month as additional data is released.
...
NOTE: The NAR is scheduled to report December existing home sales on Friday, January 19th. The consensus is for 3.84 million SAAR, up from 3.82 million in November.
...
And a table of December sales.
In December, sales in these markets were down 7.5%. In November, these same markets were down 5.6% YoY Not Seasonally Adjusted (NSA).
Sales in almost all of these markets are down sharply compared to December 2019.
...
Annual sales for 2023 will be at the lowest level since 1995.
More local markets to come!
MBA: "Office properties drove increase" in Q4 Commercial Real Estate Delinquencies
by Calculated Risk on 1/16/2024 10:45:00 AM
From the MBA: Delinquency Rates for Commercial Properties Increased in Fourth-Quarter 2023
Delinquency rates for mortgages backed by commercial properties increased during the fourth quarter of 2023, according to the Mortgage Bankers Association's (MBA) latest commercial real estate finance (CREF) Loan Performance Survey.
"Ongoing challenges in commercial real estate markets pushed the delinquency rate on CRE-backed loans higher in the final three months of 2023," said Jamie Woodwell, MBA's Head of Commercial Real Estate Research. "Delinquency rates jumped to 6.5 percent of balances for loans backed by office properties and to 6.1 percent for lodging-backed loans. Delinquencies for loans backed by retail properties remain elevated from the onset of the pandemic but were unchanged during the quarter. Delinquency rates for multifamily and industrial property loans both increased marginally but remain much lower.”
Woodwell continued, “Long-term interest rates have come down from their highs of last year, which should provide some relief to some loans, but many properties and loans still face higher rates, uncertainty about property values and – for some properties – changes in fundamentals. Each loan and property faces a different set of circumstances, which will come into play as the market works through loans that mature this year.”
emphasis added
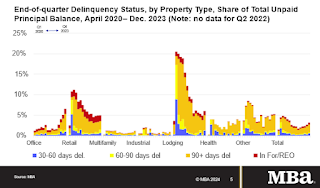 Click on graph for larger image.
Loans backed by office properties drove the increase.
• 6.5% of the balance of office property loan balances were 30 days or more days delinquent, up from 5.1% at the end of last quarter.
• 6.1% of the balance of lodging loans were delinquent, up from 4.9%.
• 5.0% of retail balances were delinquent, flat from the previous quarter.
• 1.2% of multifamily balances were delinquent, up from 0.9%.
• 0.9% of the balance of industrial property loans were delinquent, up from 0.6%.
Annual Light Vehicle Sales Increase 12% in 2023; Heavy Trucks Sales up 6% YoY
by Calculated Risk on 1/16/2024 08:17:00 AM
Earlier the BEA released their estimate of light vehicle sales for December. The BEA estimates sales of 15.83 million SAAR in December 2023 (Seasonally Adjusted Annual Rate), up 3.3% from the November sales rate, and up 16.8% from December 2022.
 Click on graph for larger image.
The first graph shows annual sales since 1976.
Sales in 2020 were impacted by the pandemic, and then sales rebounded slightly in 2021. However, sales in 2022 were impacted significantly by supply chain disruptions.
The second graph shows heavy truck sales since 1967 using data from the BEA. The dashed line is the December 2023 seasonally adjusted annual sales rate (SAAR).
Heavy truck sales really collapsed during the great recession, falling to a low of 180 thousand SAAR in May 2009. Then heavy truck sales increased to a new all-time high of 570 thousand SAAR in April 2019.
 Note: "Heavy trucks - trucks more than 14,000 pounds gross vehicle weight."
Heavy truck sales declined sharply at the beginning of the pandemic, falling to a low of 308 thousand SAAR in May 2020.
Monday, January 15, 2024
Tuesday: NY Fed Mfg
by Calculated Risk on 1/15/2024 07:11:00 PM
Weekend:
• Schedule for Week of January 14, 2024
Tuesday:
• 8:30 AM ET, The New York Fed Empire State manufacturing survey for January. The consensus is for a reading of -7.1, up from -14.5.
From CNBC: Pre-Market Data and Bloomberg futures S&P 500 are down 8 and DOW futures are down 57 (fair value).
Oil prices were down over the last week with WTI futures at $72.48 per barrel and Brent at $78.15 per barrel. A year ago, WTI was at $80, and Brent was at $83 - so WTI oil prices were down 10% year-over-year.
Here is a graph from Gasbuddy.com for nationwide gasoline prices. Nationally prices are at $3.05 per gallon. A year ago, prices were at $3.28 per gallon, so gasoline prices are down $0.23 year-over-year.
The Housing Bubble and Mortgage Debt as a Percent of GDP
by Calculated Risk on 1/15/2024 11:03:00 AM
Today, in the Calculated Risk Real Estate Newsletter: Update: The Housing Bubble and Mortgage Debt as a Percent of GDP
A brief excerpt:
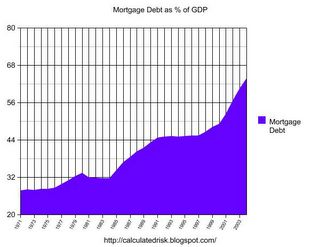
A year ago, I wrote The Housing Bubble and Mortgage Debt as a Percent of GDP. Here is an update to a couple of graphs. The bottom line remains the same: There will not be cascading price declines in this cycle due to distressed sales.There is much more in the article.
In a 2005 post, I included a graph of household mortgage debt as a percent of GDP. Several readers asked if I could update the graph.
First, from February 2005 (19 years ago!):The following chart shows household mortgage debt as a % of GDP. Although mortgage debt has been increasing for years, the last four years have seen a tremendous increase in debt. Last year alone mortgage debt increased close to $800 Billion - almost 7% of GDP. ...And a serious problem is what happened!
Many homeowners have refinanced their homes, in essence using their homes as an ATM.
It wouldn't take a RE bust to impact the general economy. Just a slowdown in both volume (to impact employment) and in prices (to slow down borrowing) might push the general economy into recession. An actual bust, especially with all of the extensive sub-prime lending, might cause a serious problem.
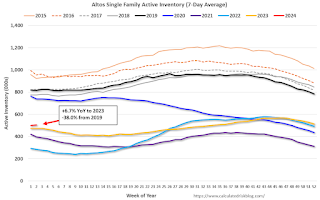
Housing January 15th Weekly Update: Inventory Up 1.2% Week-over-week, Up 6.7% Year-over-year
by Calculated Risk on 1/15/2024 08:21:00 AM
 Click on graph for larger image.
This inventory graph is courtesy of Altos Research.
Sunday, January 14, 2024
Hotels: Occupancy Rate Decreased 0.7% Year-over-year
by Calculated Risk on 1/14/2024 08:11:00 AM
U.S. hotel performance decreased from the previous week, while year-over-year comparisons improved, according to CoStar’s latest data through 6 January. ...The following graph shows the seasonal pattern for the hotel occupancy rate using the four-week average.
31 December 2023 through 6 January 2024 (percentage change from comparable week in 2023):
• Occupancy: 46.8% (-0.7%)
• Average daily rate (ADR): US$152.17 (+7.2%)
• Revenue per available room (RevPAR): US$71.28 (+6.4%)
emphasis added
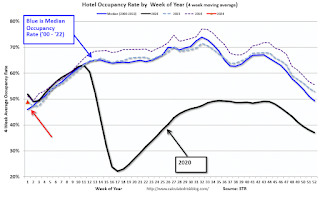 Click on graph for larger image.
The red line is for 2024, black is 2020, blue is the median, and dashed light blue is for 2023. Dashed purple is for 2018, the record year for hotel occupancy.
Saturday, January 13, 2024
Real Estate Newsletter Articles this Week: 2023 Annual Sales Likely Lowest Since 1995
by Calculated Risk on 1/13/2024 02:11:00 PM
At the Calculated Risk Real Estate Newsletter this week:
• 2nd Look at Local Housing Markets in December It appears annual sales for 2023 will be at the lowest level since 1995
• Moody's: Apartment Vacancy Rate increased in Q4; Office Vacancy Rate in "Uncharted Territory" at Record High
• Part 1: Current State of the Housing Market; Overview for mid-January 2024
• Part 2: Current State of the Housing Market; Overview for mid-January 2024
• 1st Look at Local Housing Markets in December
This is usually published 4 to 6 times a week and provides more in-depth analysis of the housing market.
Schedule for Week of January 14, 2024
by Calculated Risk on 1/13/2024 08:11:00 AM
The key reports this week are December retail sales, housing starts and existing home sales.
For manufacturing, the December Industrial Production report and the January New York and Philly Fed manufacturing surveys will be released.
All US markets will be closed in observance of Martin Luther King Jr. Day
8:30 AM: The New York Fed Empire State manufacturing survey for January. The consensus is for a reading of -7.1, up from -14.5.
7:00 AM ET: The Mortgage Bankers Association (MBA) will release the results for the mortgage purchase applications index.
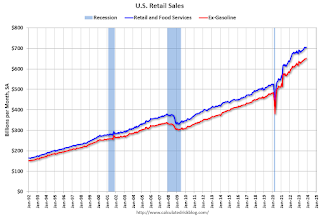 8:30 AM: Retail sales for December is scheduled to be released. The consensus is for a 0.3% increase in retail sales.
This graph shows retail sales since 1992. This is monthly retail sales and food service, seasonally adjusted (total and ex-gasoline).
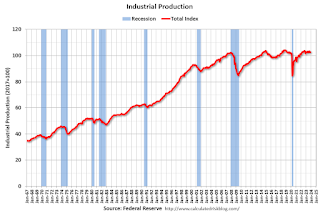 9:15 AM: The Fed will release Industrial Production and Capacity Utilization for December.
This graph shows industrial production since 1967.
The consensus is for a 0.1% decrease in Industrial Production, and for Capacity Utilization to decrease to 78.6%.
10:00 AM: The January NAHB homebuilder survey. The consensus is for a reading of 38, up from 37 in December. Any number below 50 indicates that more builders view sales conditions as poor than good.
2:00 PM: the Federal Reserve Beige Book, an informal review by the Federal Reserve Banks of current economic conditions in their Districts.
8:30 AM: The initial weekly unemployment claims report will be released. The consensus is for 204 thousand, up from 202 thousand.
 8:30 AM: Housing Starts for December.
 This graph shows single and multi-family housing starts since 1968.
The consensus is for 1.415 million SAAR, down from 1.560 million SAAR.
8:30 AM: the Philly Fed manufacturing survey for January.
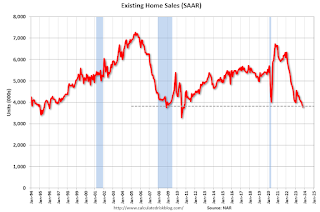 10:00 AM: Existing Home Sales for December from the National Association of Realtors (NAR). The consensus is for 3.84 million SAAR, up from 3.82 million.
The graph shows existing home sales from 1994 through the report last month.
10:00 AM: University of Michigan's Consumer sentiment index (Preliminary for January).
Friday, January 12, 2024
Jan 12th COVID Update: Hospitalizations Increased
by Calculated Risk on 1/12/2024 07:54:00 PM
| COVID Metrics | ||||
|---|---|---|---|---|
| Now | Week Ago | Goal | ||
| Hospitalized2🚩 | 29,285 | 26,079 | ≤3,0001 | |
| Deaths per Week2 | 1,500 | 1,689 | ≤3501 | |
| 1my goals to stop weekly posts, 2Weekly for Currently Hospitalized, and Deaths 🚩 Increasing number weekly for Hospitalized and Deaths ✅ Goal met. | ||||
 Click on graph for larger image.
This graph shows the weekly (columns) number of deaths reported.
And here is a new graph I'm following on COVID in wastewater as of Jan 11th:
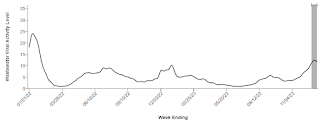 This appears to be a leading indicator for COVID hospitalizations and deaths.
