by Calculated Risk on 1/17/2024 10:00:00 AM
Wednesday, January 17, 2024
NAHB: Builder Confidence Increased in January
The National Association of Home Builders (NAHB) reported the housing market index (HMI) was at 44, up from 37 last month. Any number below 50 indicates that more builders view sales conditions as poor than good.
From the NAHB: Builder Sentiment Surges on Falling Interest Rates
Mortgage rates well under 7% over the past month have led to a sharp increase in builder confidence to begin the new year.
Builder confidence in the market for newly built single-family homes climbed seven points to 44 in January, according to the National Association of Home Builders (NAHB)/Wells Fargo Housing Market Index (HMI) released today. This second consecutive monthly increase in builder confidence closely tracks with a period of falling interest rates.
“Lower interest rates improved housing affordability conditions this past month, bringing some buyers back into the market after being sidelined in the fall by higher borrowing costs,” said NAHB Chairman Alicia Huey, a custom home builder and developer from Birmingham, Ala. “Single-family starts are expected to grow in 2024, adding much needed inventory to the market. However, builders will face growing challenges with building material cost and availability, as well as lot supply.”
“Mortgage rates have decreased by more than 110 basis points since late October per Freddie Mac, lifting the future sales expectation component in the HMI into positive territory for the first time since August,” said NAHB Chief Economist Robert Dietz. “As home building expands in 2024, the market will see growing supply-side challenges in the form of higher prices and/or shortages of lumber, lots and labor.”
Even as mortgage rates have fallen below 7% over the past month, many builders continue to reduce home prices to boost sales. In January, 31% of builders reported cutting home prices, down from 36% during the previous two months and the lowest rate since last August. The average price reduction in January remained at 6%, unchanged from the previous month. Meanwhile, 62% of builders provided sales incentives of all forms in January. This share has remained stable between 60% and 62% since October.
...
All three of the major HMI indices posted gains in January. The HMI index charting current sales conditions increased seven points to 48, the component measuring sales expectations in the next six months jumped 12 points to 57 and the component gauging traffic of prospective buyers rose five points to 29.
Looking at the three-month moving averages for regional HMI scores, the Northeast increased four points to 55, the South increased two points to 41, the West registered a one-point gain to 32 and the Midwest held steady at 34.
emphasis added
 Click on graph for larger image.
This graph shows the NAHB index since Jan 1985.
This was above the consensus forecast.
Industrial Production Increased 0.1% in December
by Calculated Risk on 1/17/2024 09:15:00 AM
From the Fed: Industrial Production and Capacity Utilization
Industrial production moved up 0.1 percent in December and declined 3.1 percent at an annual rate in the fourth quarter. Manufacturing output edged up 0.1 percent in December after increasing 0.2 percent in November. The index for utilities declined 1.0 percent in December, while the index for mining rose 0.9 percent. At 102.5 percent of its 2017 average, total industrial production in December was 1 percent above its year-earlier level. Capacity utilization was unchanged in December at 78.6 percent, a rate that is 1.1 percentage points below its long-run (1972–2022) average.
emphasis added
 Click on graph for larger image.
This graph shows Capacity Utilization. This series is up from the record low set in April 2020, and above the level in February 2020 (pre-pandemic).
Capacity utilization at 78.6% is 1.1% below the average from 1972 to 2022. This was at consensus expectations.
Note: y-axis doesn't start at zero to better show the change.
 The second graph shows industrial production since 1967.
Industrial production increased to 102.7. This is above the pre-pandemic level.
Industrial production was above consensus expectations.
Retail Sales Increased 0.6% in December
by Calculated Risk on 1/17/2024 08:30:00 AM
On a monthly basis, retail sales were up 0.6% from November to December (seasonally adjusted), and sales were up 5.6 percent from December 2022.
From the Census Bureau report:
Advance estimates of U.S. retail and food services sales for December 2023, adjusted for seasonal variation and holiday and trading-day differences, but not for price changes, were $709.9 billion, up 0.6 percent from the previous month, and up 5.6 percent above December 2022. Total sales for the 12 months of 2023 were up 3.2 percent (±0.4 percent) from 2022. ... The October 2023 to November 2023 percent change was unrevised from up 0.3 percent.
emphasis added
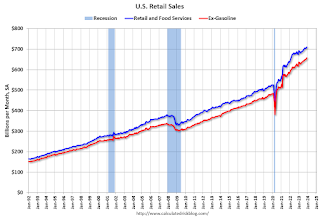 Click on graph for larger image.
This graph shows retail sales since 1992. This is monthly retail sales and food service, seasonally adjusted (total and ex-gasoline).
Retail sales ex-gasoline was up 0.7% in December.
The second graph shows the year-over-year change in retail sales and food service (ex-gasoline) since 1993.
Retail and Food service sales, ex-gasoline, increased by 6.5% on a YoY basis.
 The increase in sales in December was above expectations, and sales in October and November were mostly unrevised (combined).
MBA: Mortgage Applications Increased in Weekly Survey
by Calculated Risk on 1/17/2024 07:00:00 AM
From the MBA: Mortgage Applications Increase in Latest MBA Weekly Survey
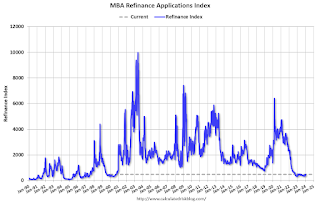
Mortgage applications increased 10.4 percent from one week earlier, according to data from the Mortgage Bankers Association’s (MBA) Weekly Mortgage Applications Survey for the week ending January 12, 2024. Last week’s results included an adjustment to account for the New Year’s holiday.
The Market Composite Index, a measure of mortgage loan application volume, increased 10.4 percent on a seasonally adjusted basis from one week earlier. On an unadjusted basis, the Index increased 26 percent compared with the previous week. The Refinance Index increased 11 percent from the previous week and was 10 percent higher than the same week one year ago. The seasonally adjusted Purchase Index increased 9 percent from one week earlier. The unadjusted Purchase Index increased 28 percent compared with the previous week and was 20 percent lower than the same week one year ago.
“Mortgage rates declined across all loan types as Treasury yields moved lower last week on incoming inflation data, which helped to support a rise in mortgage applications. The 30-year fixed rate decreased six basis points to 6.75 percent, the lowest rate in three weeks,” said Joel Kan, MBA’s Vice President and Deputy Chief Economist. “Compared to a holiday-adjusted week, both purchase and refinance applications were up, and the increases were heavily driven by the conventional market. Although purchase activity is lagging year-ago levels, refinance applications have improved from their recent low point and have been showing year-over-year gains, albeit at low levels. If rates continue to ease, MBA is cautiously optimistic that home purchases will pick up in the coming months.”
...
The average contract interest rate for 30-year fixed-rate mortgages with conforming loan balances ($726,200 or less) decreased to 6.75 percent from 6.81 percent, with points increasing to 0.62 from 0.61 (including the origination fee) for 80 percent loan-to-value ratio (LTV) loans.
emphasis added
 Click on graph for larger image.
The first graph shows the MBA mortgage purchase index.
According to the MBA, purchase activity is down 20% year-over-year unadjusted.
Tuesday, January 16, 2024
Wednesday: Retail Sales, Industrial Production, Homebuilder Survey, Beige Book
by Calculated Risk on 1/16/2024 08:03:00 PM
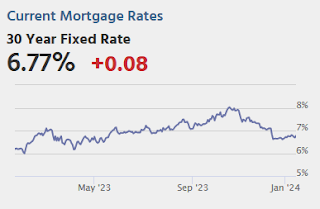
[R]ates were near 8% when the Nov/Dec rally began and fell into the 6.6s by December 14th. They're currently still well under 7%, meaning that a vast majority of the improvement has been retained despite the modest erosion. [30 year fixed 6.77%]Wednesday:
emphasis added
• At 7:00 AM ET: The Mortgage Bankers Association (MBA) will release the results for the mortgage purchase applications index.
• At 8:30 AM, Retail sales for December is scheduled to be released. The consensus is for a 0.3% increase in retail sales.
• At 9:15 AM, The Fed will release Industrial Production and Capacity Utilization for December. The consensus is for a 0.1% decrease in Industrial Production, and for Capacity Utilization to decrease to 78.6%.
• At 10:00 AM, The January NAHB homebuilder survey. The consensus is for a reading of 38, up from 37 in December. Any number below 50 indicates that more builders view sales conditions as poor than good.
• At 2:00 PM, the Federal Reserve Beige Book, an informal review by the Federal Reserve Banks of current economic conditions in their Districts.
3rd Look at Local Housing Markets in December
by Calculated Risk on 1/16/2024 12:59:00 PM
Today, in the Calculated Risk Real Estate Newsletter: 3rd Look at Local Housing Markets in December
A brief excerpt:
NOTE: The tables for active listings, new listings and closed sales all include a comparison to December 2019 for each local market (some 2019 data is not available).There is much more in the article.
This is the third look at several local markets in December. I’m tracking about 40 local housing markets in the US. Some of the 40 markets are states, and some are metropolitan areas. I’ll update these tables throughout the month as additional data is released.
...
NOTE: The NAR is scheduled to report December existing home sales on Friday, January 19th. The consensus is for 3.84 million SAAR, up from 3.82 million in November.
...
And a table of December sales.
In December, sales in these markets were down 7.5%. In November, these same markets were down 5.6% YoY Not Seasonally Adjusted (NSA).
Sales in almost all of these markets are down sharply compared to December 2019.
...
Annual sales for 2023 will be at the lowest level since 1995.
More local markets to come!
MBA: "Office properties drove increase" in Q4 Commercial Real Estate Delinquencies
by Calculated Risk on 1/16/2024 10:45:00 AM
From the MBA: Delinquency Rates for Commercial Properties Increased in Fourth-Quarter 2023
Delinquency rates for mortgages backed by commercial properties increased during the fourth quarter of 2023, according to the Mortgage Bankers Association's (MBA) latest commercial real estate finance (CREF) Loan Performance Survey.
"Ongoing challenges in commercial real estate markets pushed the delinquency rate on CRE-backed loans higher in the final three months of 2023," said Jamie Woodwell, MBA's Head of Commercial Real Estate Research. "Delinquency rates jumped to 6.5 percent of balances for loans backed by office properties and to 6.1 percent for lodging-backed loans. Delinquencies for loans backed by retail properties remain elevated from the onset of the pandemic but were unchanged during the quarter. Delinquency rates for multifamily and industrial property loans both increased marginally but remain much lower.”
Woodwell continued, “Long-term interest rates have come down from their highs of last year, which should provide some relief to some loans, but many properties and loans still face higher rates, uncertainty about property values and – for some properties – changes in fundamentals. Each loan and property faces a different set of circumstances, which will come into play as the market works through loans that mature this year.”
emphasis added
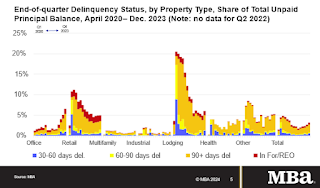 Click on graph for larger image.
Loans backed by office properties drove the increase.
• 6.5% of the balance of office property loan balances were 30 days or more days delinquent, up from 5.1% at the end of last quarter.
• 6.1% of the balance of lodging loans were delinquent, up from 4.9%.
• 5.0% of retail balances were delinquent, flat from the previous quarter.
• 1.2% of multifamily balances were delinquent, up from 0.9%.
• 0.9% of the balance of industrial property loans were delinquent, up from 0.6%.
Annual Light Vehicle Sales Increase 12% in 2023; Heavy Trucks Sales up 6% YoY
by Calculated Risk on 1/16/2024 08:17:00 AM
Earlier the BEA released their estimate of light vehicle sales for December. The BEA estimates sales of 15.83 million SAAR in December 2023 (Seasonally Adjusted Annual Rate), up 3.3% from the November sales rate, and up 16.8% from December 2022.
 Click on graph for larger image.
The first graph shows annual sales since 1976.
Sales in 2020 were impacted by the pandemic, and then sales rebounded slightly in 2021. However, sales in 2022 were impacted significantly by supply chain disruptions.
The second graph shows heavy truck sales since 1967 using data from the BEA. The dashed line is the December 2023 seasonally adjusted annual sales rate (SAAR).
Heavy truck sales really collapsed during the great recession, falling to a low of 180 thousand SAAR in May 2009. Then heavy truck sales increased to a new all-time high of 570 thousand SAAR in April 2019.
 Note: "Heavy trucks - trucks more than 14,000 pounds gross vehicle weight."
Heavy truck sales declined sharply at the beginning of the pandemic, falling to a low of 308 thousand SAAR in May 2020.
Monday, January 15, 2024
Tuesday: NY Fed Mfg
by Calculated Risk on 1/15/2024 07:11:00 PM
Weekend:
• Schedule for Week of January 14, 2024
Tuesday:
• 8:30 AM ET, The New York Fed Empire State manufacturing survey for January. The consensus is for a reading of -7.1, up from -14.5.
From CNBC: Pre-Market Data and Bloomberg futures S&P 500 are down 8 and DOW futures are down 57 (fair value).
Oil prices were down over the last week with WTI futures at $72.48 per barrel and Brent at $78.15 per barrel. A year ago, WTI was at $80, and Brent was at $83 - so WTI oil prices were down 10% year-over-year.
Here is a graph from Gasbuddy.com for nationwide gasoline prices. Nationally prices are at $3.05 per gallon. A year ago, prices were at $3.28 per gallon, so gasoline prices are down $0.23 year-over-year.
The Housing Bubble and Mortgage Debt as a Percent of GDP
by Calculated Risk on 1/15/2024 11:03:00 AM
Today, in the Calculated Risk Real Estate Newsletter: Update: The Housing Bubble and Mortgage Debt as a Percent of GDP
A brief excerpt:
A year ago, I wrote The Housing Bubble and Mortgage Debt as a Percent of GDP. Here is an update to a couple of graphs. The bottom line remains the same: There will not be cascading price declines in this cycle due to distressed sales.There is much more in the article.
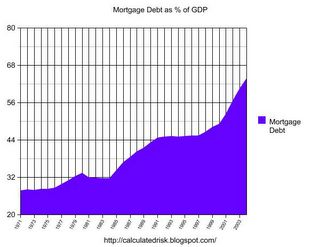
In a 2005 post, I included a graph of household mortgage debt as a percent of GDP. Several readers asked if I could update the graph.
First, from February 2005 (19 years ago!):The following chart shows household mortgage debt as a % of GDP. Although mortgage debt has been increasing for years, the last four years have seen a tremendous increase in debt. Last year alone mortgage debt increased close to $800 Billion - almost 7% of GDP. ...And a serious problem is what happened!
Many homeowners have refinanced their homes, in essence using their homes as an ATM.
It wouldn't take a RE bust to impact the general economy. Just a slowdown in both volume (to impact employment) and in prices (to slow down borrowing) might push the general economy into recession. An actual bust, especially with all of the extensive sub-prime lending, might cause a serious problem.

