 RSS Feed
 by Calculated Risk on 1/22/2024 01:45:00 PM
Monday, January 22, 2024
NMHC: "Apartment Market Continues to Loosen"
Today, in the CalculatedRisk Real Estate Newsletter: NMHC: "Apartment Market Continues to Loosen"
Excerpt:
From the NMHC: Financing Conditions Show Signs of Improvement, Apartment Market Continues to Loosen with Decreasing Deal FlowThere is much more in the article.Apartment market conditions continued to weaken in the National Multifamily Housing Council's (NMHC) Quarterly Survey of Apartment Market Conditions for January 2024. With the exception of Debt Financing (66), which turned positive this quarter, the Market Tightness (23), Sales Volume (34), and Equity Financing (44) indexes all came in below the breakeven level (50).
...
"Yet, the apartment market continues to record decreasing rent growth and rising vacancy rates as it absorbs the highest level of new supply in more than thirty years.”• The Market Tightness Index came in at 23 this quarter – below the breakeven level (50) – indicating looser market conditions for the sixth consecutive quarter. A majority of respondents (59%) reported markets to be looser than three months ago, while only 5% thought markets have become tighter. Thirty-five percent of respondents thought market conditions had gone unchanged over the past three months.The quarterly index increased to 23 in January from 21 in October. Any reading below 50 indicates looser conditions from the previous quarter.
This index has been an excellent leading indicator for rents and vacancy rates, and this suggests higher vacancy rates and a further weakness in asking rents. This is the sixth consecutive quarter with looser conditions than the previous quarter.

Update on High Frequency Indicators: Airlines and Movie Tickets
by Calculated Risk on 1/22/2024 11:21:00 AM
I stopped the weekly updates of high frequency indicators at the end of 2022.
Here is an early 2024 look at two indicators:
The TSA is providing daily travel numbers.
This data is as of January 21, 2024.
 Click on graph for larger image.
This data shows the 7-day average of daily total traveler throughput from the TSA for 2019 (Light Blue), 2020 (Black), 2021 (Blue), 2022 (Purple) and 2023 (Orange), and 2024 (Red).
The dashed line is the percent of 2019 for the seven-day average.
The 7-day average is above the level for the same week in 2019 (104.1% of 2019). (Dashed line)
Air travel - as a percent of 2019 - is tracking solidly above pre-pandemic levels.
----- Movie Tickets: Box Office Mojo -----
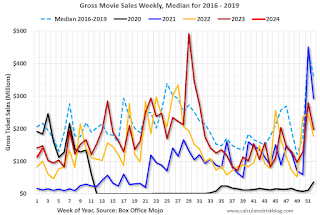 This data shows domestic box office for each week and the median for the years 2016 through 2019 (dashed light blue).
 This data shows domestic box office for each week and the median for the years 2016 through 2019 (dashed light blue).
 Black is 2020, Blue is 2021, Orange is 2022, Dark Red is 2024, and Red is 2024.
The data is from BoxOfficeMojo through January 18th.
Note that the data is usually noisy week-to-week and depends on when blockbusters are released.
Movie ticket sales (dollars) have mostly been running below the pre-pandemic levels.
Note that the data is usually noisy week-to-week and depends on when blockbusters are released.
Movie ticket sales (dollars) have mostly been running below the pre-pandemic levels.
Housing January 22nd Weekly Update: Inventory Up 0.2% Week-over-week, Up 7.1% Year-over-year
by Calculated Risk on 1/22/2024 08:21:00 AM
Altos reports that active single-family inventory was up 0.2% week-over-week. It is not unusually to get a small increase after the holidays; however, inventory will likely decrease a little seasonally until the Spring (it could remain mostly flat for a few months like in 2019).
 Click on graph for larger image.
This inventory graph is courtesy of Altos Research.
As of January 19th, inventory was at 506 thousand (7-day average), compared to 505 thousand the prior week.
Inventory is still far below pre-pandemic levels.

The red line is for 2024. The black line is for 2019. Note that inventory is up from the record low for the same week in 2022, but still well below normal levels.
Inventory was up 7.1% compared to the same week in 2023 (last week it was up 6.7%), and down 38.6% compared to the same week in 2019 (last week down 38.0%).
Back in June 2023, inventory was down almost 54% compared to 2019, so the gap to more normal inventory levels has closed a little.
Mike Simonsen discusses this data regularly on Youtube.
Sunday, January 21, 2024
Sunday Night Futures
by Calculated Risk on 1/21/2024 06:41:00 PM
Weekend:
• Schedule for Week of January 21, 2024
Monday:
• No major economic releases are scheduled.
From CNBC: Pre-Market Data and Bloomberg futures S&P 500 are up 5 and DOW futures are up 34 (fair value).
Oil prices were up slightly over the last week with WTI futures at $73.57 per barrel and Brent at $78.43 per barrel. A year ago, WTI was at $81, and Brent was at $87 - so WTI oil prices were down 10% year-over-year.
Here is a graph from Gasbuddy.com for nationwide gasoline prices. Nationally prices are at $3.05 per gallon. A year ago, prices were at $3.39 per gallon, so gasoline prices are down $0.34 year-over-year.
Hotels: Occupancy Rate Decreased 2.8% Year-over-year
by Calculated Risk on 1/21/2024 08:21:00 AM
U.S. Hotel performance increased from the previous week, while year-over-year comparisons remained mixed, according to CoStar’s latest data through 13 January. ...The following graph shows the seasonal pattern for the hotel occupancy rate using the four-week average.
7-13 January 2024 (percentage change from comparable week in 2023):
• Occupancy: 53.3% (-2.8%)
• Average daily rate (ADR): US$153.84 (+6.3%)
• Revenue per available room (RevPAR): US$81.96 (+3.3%)
emphasis added
 Click on graph for larger image.
The red line is for 2024, black is 2020, blue is the median, and dashed light blue is for 2023. Dashed purple is for 2018, the record year for hotel occupancy.
The 4-week average of the occupancy rate is tracking close to last year, and above the median rate for the period 2000 through 2022 (Blue).
Note: Y-axis doesn't start at zero to better show the seasonal change.
The 4-week average of the occupancy rate will increase seasonally over the next 3 months.
Saturday, January 20, 2024
Real Estate Newsletter Articles this Week: Existing Home Months-of-Supply above December 2019
by Calculated Risk on 1/20/2024 02:11:00 PM
At the Calculated Risk Real Estate Newsletter this week:
• Single Family Starts Up Year-over-year in December; Near Record Number of Multi-Family Housing Units Under Construction
• NAR: Existing-Home Sales Decreased to 3.78 million SAAR in December; Months-of-Supply above December 2019
• 4th Look at Local Housing Markets in December; California Home Sales Down 7.1% YoY in December
• Update: The Housing Bubble and Mortgage Debt as a Percent of GDP
• Lawler: Early Read on Existing Home Sales in December
• https://calculatedrisk.substack.com/p/3rd-look-at-local-housing-markets-3cd
This is usually published 4 to 6 times a week and provides more in-depth analysis of the housing market.
Schedule for Week of January 21, 2024
by Calculated Risk on 1/20/2024 08:11:00 AM
The key reports scheduled for this week are the advance estimate of Q4 GDP, December New Home sales and December Personal Income and Outlays.
For manufacturing, the Richmond and Kansas City Fed manufacturing surveys will be released.
No major economic releases are scheduled.
10:00 AM: Richmond Fed Survey of Manufacturing Activity for January.
10:00 AM: State Employment and Unemployment (Monthly) for December 2023
7:00 AM ET: The Mortgage Bankers Association (MBA) will release the results for the mortgage purchase applications index.
During the day: The AIA's Architecture Billings Index for December (a leading indicator for commercial real estate).
8:30 AM: Gross Domestic Product, 4th quarter and Year 2023 (Advance estimate). The consensus is that real GDP increased 1.8% annualized in Q4.
8:30 AM: The initial weekly unemployment claims report will be released. The consensus is for 200 thousand initial claims, up from 187 thousand last week.
8:30 AM: Durable Goods Orders for December. The consensus is for a 0.5% increase in durable goods.
8:30 AM ET: Chicago Fed National Activity Index for December. This is a composite index of other data.
 10:00 AM: New Home Sales for December from the Census Bureau.
 This graph shows New Home Sales since 1963.
The dashed line is the sales rate for last month.
The consensus is for 650 thousand SAAR, up from 590 thousand in November.
11:00 AM: the Kansas City Fed manufacturing survey for January.
8:30 AM ET: Personal Income and Outlays for December. The consensus is for a 0.3% increase in personal income, and for a 0.4% increase in personal spending. And for the Core PCE price index to increase 0.2%. PCE prices are expected to be up 2.6% YoY, and core PCE prices up 3.0% YoY.
10:00 AM: Pending Home Sales Index for December. The consensus is for a 2.0% increase in the index.
Friday, January 19, 2024
Jan 19th COVID Update: Weekly Deaths Increased
by Calculated Risk on 1/19/2024 07:45:00 PM
 Note: Mortgage rates are from MortgageNewsDaily.com and are for top tier scenarios.
Due to changes at the CDC, weekly cases are no longer updated.
For deaths, I'm currently using 4 weeks ago for "now", since the most recent three weeks will be revised significantly.
Hospitalizations have more than quintupled from a low of 5,150 in June 2023.
Hospitalizations are about 20% of the peak of 150,000 in January 2022.
| COVID Metrics | ||||
|---|---|---|---|---|
| Now | Week Ago | Goal | ||
| Hospitalized2 | 27,882 | 29,807 | ≤3,0001 | |
| Deaths per Week2🚩 | 1,768 | 1,712 | ≤3501 | |
| 1my goals to stop weekly posts, 2Weekly for Currently Hospitalized, and Deaths 🚩 Increasing number weekly for Hospitalized and Deaths ✅ Goal met. | ||||
 Click on graph for larger image.
This graph shows the weekly (columns) number of deaths reported.
Weekly deaths have more than tripled from a low of 485 in early July. Still weekly deaths are far below the weekly peak of 26,000 in January 2021.
Q4 GDP Tracking: Around 1.8%
by Calculated Risk on 1/19/2024 02:01:00 PM
The advance estimate of Q4 GDP will be released next week, and the consensus is for real GDP (SAAR) of 1.8%.
From BofA:
Overall, since our last weekly publication, our 4Q US GDP tracking estimate is up two-tenths to 1.3% q/q saar, while 3Q GDP finalized at 4.9% q/q saar in the third estimate. [Jan 12th estimate]From Goldman:
emphasis added
Following today’s data, we left our Q4 GDP tracking unchanged at +1.8% (qoq ar) and our Q4 domestic final sales growth forecast also unchanged at +2.5% (qoq ar). [Jan 19th estimate]And from the Altanta Fed: GDPNow
The GDPNow model estimate for real GDP growth (seasonally adjusted annual rate) in the fourth quarter of 2023 is 2.4 percent on January 19, unchanged from January 18 after rounding. After this morning's existing-home sales report from the National Association of Realtors, the nowcast of fourth-quarter real residential investment growth decreased from -0.4 percent to -0.6 percent. [Jan 19th estimate]
NAR: Existing-Home Sales Decreased to 3.78 million SAAR in December; Months-of-Supply above December 2019
by Calculated Risk on 1/19/2024 10:50:00 AM
Today, in the CalculatedRisk Real Estate Newsletter: NAR: Existing-Home Sales Decreased to 3.78 million SAAR in December; Months-of-Supply above December 2019
Excerpt:
Sales Year-over-Year and Not Seasonally Adjusted (NSA)There is much more in the article.
The fourth graph shows existing home sales by month for 2022 and 2023.
Sales declined 6.2% year-over-year compared to December 2022. This was the twenty-eighth consecutive month with sales down year-over-year. This was just below the previous cycle low of 3.79 million SAAR in October.
On an annual basis, sales were down 19% from 2022 to the lowest level since 1995.


