 RSS Feed
 by Calculated Risk on 1/24/2024 07:00:00 AM
Wednesday, January 24, 2024
MBA: Mortgage Applications Increased in Weekly Survey
From the MBA: Mortgage Applications Increase in Latest MBA Weekly Survey
Mortgage applications increased 3.7 percent from one week earlier, according to data from the Mortgage Bankers Association’s (MBA) Weekly Mortgage Applications Survey for the week ending January 19, 2024. The results include an adjustment to account for the MLK holiday.
The Market Composite Index, a measure of mortgage loan application volume, increased 3.7 percent on a seasonally adjusted basis from one week earlier. On an unadjusted basis, the Index decreased 4 percent compared with the previous week. The holiday adjusted Refinance Index decreased 7 percent from the previous week and was 8 percent lower than the same week one year ago. The unadjusted Refinance Index decreased 16 percent from the previous week and was 8 percent lower than the same week one year ago. The seasonally adjusted Purchase Index increased 8 percent from one week earlier. The unadjusted Purchase Index increased 3 percent compared with the previous week and was 18 percent lower than the same week one year ago.
“Mortgage rates increased slightly last week but, there continues to be an upward trend in purchase activity. Conventional and FHA purchase applications drove most of the increase last week as some buyers moved to act early this season,” said Joel Kan, MBA’s Vice President and Deputy Chief Economist. “Refinance applications declined over the week and remained at low levels. There is still little incentive for homeowners to refinance with rates at these levels.”
...
The average contract interest rate for 30-year fixed-rate mortgages with conforming loan balances ($726,200 or less) increased to 6.78 percent from 6.75 percent, with points increasing to 0.63 from 0.62 (including the origination fee) for 80 percent loan-to-value ratio (LTV) loans.
emphasis added
 Click on graph for larger image.
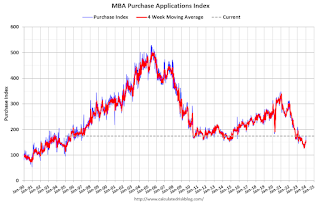
The first graph shows the MBA mortgage purchase index.
According to the MBA, purchase activity is down 18% year-over-year unadjusted.
Red is a four-week average (blue is weekly).
Purchase application activity is up from the lows in late October and early November, but still close to the lowest levels during the housing bust.

The second graph shows the refinance index since 1990.
With higher mortgage rates, the refinance index declined sharply in 2022, and even with some recent increases, activity is barely off the bottom.
Tuesday, January 23, 2024
Wednesday: Architecture Billings Index
by Calculated Risk on 1/23/2024 07:23:00 PM
 Note: Mortgage rates are from MortgageNewsDaily.com and are for top tier scenarios.
Wednesday:
• At 7:00 AM ET, The Mortgage Bankers Association (MBA) will release the results for the mortgage purchase applications index.
• During the day: The AIA's Architecture Billings Index for December (a leading indicator for commercial real estate).
NMHC and Fannie Mae Multi-Family Presentation
by Calculated Risk on 1/23/2024 11:31:00 AM
Yesterday, Chris Bruen, Senior Director of Research at NMHC and Kim Betancourt, CRE, Vice President, Multifamily Economics and Strategic Research at Fannie Mae presented the State of the Multi-Family Market (see video recording of presentation).
Here are a couple of slides from the presentation by Betancourt:
 The first graph shows quarterly rents and the vacancy rate over time.
Rents surged in 2021, and then moved more sideways - and even declined in Q4 2023.
The vacancy rate bottomed in Q2 2022 and has steadily increased. This is due to a combination more supply and less household formation (not mentioned in the presentation).
The second graph shows annual rents and vacancy rates.
 Fannie expects rent growth to be sluggish in 2024, and the for the vacancy rate to increase to 6.25%.
There are a couple of more graph in the presentation showing coming multi-family supply and rents by metro area.
1.54 million Total Housing Completions in 2023 including Manufactured Homes; Most Since 2007
by Calculated Risk on 1/23/2024 08:37:00 AM
Today, in the CalculatedRisk Real Estate Newsletter: 1.54 million Total Housing Completions in 2023 including Manufactured Homes; Most Since 2007
Excerpt:
Although total housing starts decreased 9.0% in 2023 compared to 2022, completions increased year-over-year. Construction delays impacted completions in 2023, and that left a near record number of housing units under construction. However, there still were 1.543 million total completions and placements in 2023, the most since 2007.There is much more in the article.
Not counting Manufactured homes, there are 1.453 million completions in 2023, up 4.5% from 1.390 million in 2022, and also the most since 2007.
This graph shows total housing completions and placements since 1968 through 2023. Note that the net addition to the housing stock is less because of demolitions and destruction of older housing units. The housing start report last week indicated 1,002.4 thousand single family completions in 2023, 11.5 thousand in 2-to-4 units, and 438.6 thousand in 5+ units (up 22% from 2022, and the most since 1987).

Monday, January 22, 2024
Tuesday: Richmond Fed Mfg
by Calculated Risk on 1/22/2024 07:10:00 PM
 From Matthew Graham at Mortgage News Daily: Modest Gains. No Particular Reason
The week got off to a slow start as far as the bond market was concerned. Volume was the lowest of the year so far, even if only by a small margin. Volatility was also muted, at best. The overnight session provided modest gains and about half of the gains stuck around through the close. Even so, the improvement wasn't remotely enough to change the prevailing landscape in which bonds are in a modest uptrend in search of a short-term ceiling from which to carve out a broader sideways set-up for the more important events in the next 3 weeks. [30 year fixed 6.87%]Tuesday:
emphasis added
• At 10:00 AM ET, Richmond Fed Survey of Manufacturing Activity for January.
• Also at 10:00 AM, State Employment and Unemployment (Monthly) for December 2023
MBA Survey: "Share of Mortgage Loans in Forbearance Decreases to 0.23% in December"
by Calculated Risk on 1/22/2024 04:11:00 PM
From the MBA: Share of Mortgage Loans in Forbearance Decreases to 0.23% in December
The Mortgage Bankers Association’s (MBA) monthly Loan Monitoring Survey revealed that the total number of loans now in forbearance decreased by 3 basis points from 0.26% of servicers’ portfolio volume in the prior month to 0.23% as of December 31, 2023. According to MBA’s estimate, 115,000 homeowners are in forbearance plans. Mortgage servicers have provided forbearance to approximately 8.1 million borrowers since March 2020.At the end of December, there were about 115,000 homeowners in forbearance plans.
In December 2023, the share of Fannie Mae and Freddie Mac loans in forbearance declined 1 basis point to 0.15%. Ginnie Mae loans in forbearance decreased 8 basis points to 0.39%, and the forbearance share for portfolio loans and private-label securities (PLS) decreased 3 basis points to 0.27%.
“Forbearance as a loss mitigation option is diminishing,” said Marina Walsh, CMB, MBA’s Vice President of Industry Analysis. “While forbearance is a powerful tool for delinquency surges resulting from natural disasters or major disruptions such as a pandemic, today’s borrowers are not experiencing widespread financial distress. The overall performance of servicing portfolios – particularly government loans – declined in December. Factors such as seasonality, a changing labor market, resumption of student loan payments, and the rise in balances on other forms of consumer debt are likely at play.”
...
• By reason, 61.2% of borrowers are in forbearance for reasons such as a temporary hardship caused by job loss, death, divorce, or disability; while 26.8% of borrowers are in forbearance because of COVID-19. Another 12.0% are in forbearance because of a natural disaster.emphasis added
NMHC: "Apartment Market Continues to Loosen"
by Calculated Risk on 1/22/2024 01:45:00 PM
Today, in the CalculatedRisk Real Estate Newsletter: NMHC: "Apartment Market Continues to Loosen"
Excerpt:
From the NMHC: Financing Conditions Show Signs of Improvement, Apartment Market Continues to Loosen with Decreasing Deal FlowThere is much more in the article.Apartment market conditions continued to weaken in the National Multifamily Housing Council's (NMHC) Quarterly Survey of Apartment Market Conditions for January 2024. With the exception of Debt Financing (66), which turned positive this quarter, the Market Tightness (23), Sales Volume (34), and Equity Financing (44) indexes all came in below the breakeven level (50).
...
"Yet, the apartment market continues to record decreasing rent growth and rising vacancy rates as it absorbs the highest level of new supply in more than thirty years.”• The Market Tightness Index came in at 23 this quarter – below the breakeven level (50) – indicating looser market conditions for the sixth consecutive quarter. A majority of respondents (59%) reported markets to be looser than three months ago, while only 5% thought markets have become tighter. Thirty-five percent of respondents thought market conditions had gone unchanged over the past three months.The quarterly index increased to 23 in January from 21 in October. Any reading below 50 indicates looser conditions from the previous quarter.
This index has been an excellent leading indicator for rents and vacancy rates, and this suggests higher vacancy rates and a further weakness in asking rents. This is the sixth consecutive quarter with looser conditions than the previous quarter.

Update on High Frequency Indicators: Airlines and Movie Tickets
by Calculated Risk on 1/22/2024 11:21:00 AM
I stopped the weekly updates of high frequency indicators at the end of 2022.
Here is an early 2024 look at two indicators:
The TSA is providing daily travel numbers.
This data is as of January 21, 2024.
 Click on graph for larger image.
This data shows the 7-day average of daily total traveler throughput from the TSA for 2019 (Light Blue), 2020 (Black), 2021 (Blue), 2022 (Purple) and 2023 (Orange), and 2024 (Red).
The dashed line is the percent of 2019 for the seven-day average.
The 7-day average is above the level for the same week in 2019 (104.1% of 2019). (Dashed line)
Air travel - as a percent of 2019 - is tracking solidly above pre-pandemic levels.
----- Movie Tickets: Box Office Mojo -----
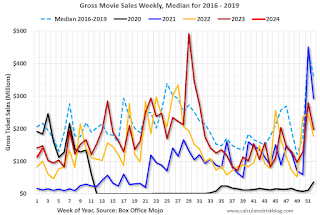 This data shows domestic box office for each week and the median for the years 2016 through 2019 (dashed light blue).
 This data shows domestic box office for each week and the median for the years 2016 through 2019 (dashed light blue).
 Black is 2020, Blue is 2021, Orange is 2022, Dark Red is 2024, and Red is 2024.
The data is from BoxOfficeMojo through January 18th.
Note that the data is usually noisy week-to-week and depends on when blockbusters are released.
Movie ticket sales (dollars) have mostly been running below the pre-pandemic levels.
Note that the data is usually noisy week-to-week and depends on when blockbusters are released.
Movie ticket sales (dollars) have mostly been running below the pre-pandemic levels.
Housing January 22nd Weekly Update: Inventory Up 0.2% Week-over-week, Up 7.1% Year-over-year
by Calculated Risk on 1/22/2024 08:21:00 AM
Altos reports that active single-family inventory was up 0.2% week-over-week. It is not unusually to get a small increase after the holidays; however, inventory will likely decrease a little seasonally until the Spring (it could remain mostly flat for a few months like in 2019).
 Click on graph for larger image.
This inventory graph is courtesy of Altos Research.
As of January 19th, inventory was at 506 thousand (7-day average), compared to 505 thousand the prior week.
Inventory is still far below pre-pandemic levels.

The red line is for 2024. The black line is for 2019. Note that inventory is up from the record low for the same week in 2022, but still well below normal levels.
Inventory was up 7.1% compared to the same week in 2023 (last week it was up 6.7%), and down 38.6% compared to the same week in 2019 (last week down 38.0%).
Back in June 2023, inventory was down almost 54% compared to 2019, so the gap to more normal inventory levels has closed a little.
Mike Simonsen discusses this data regularly on Youtube.
Sunday, January 21, 2024
Sunday Night Futures
by Calculated Risk on 1/21/2024 06:41:00 PM
Weekend:
• Schedule for Week of January 21, 2024
Monday:
• No major economic releases are scheduled.
From CNBC: Pre-Market Data and Bloomberg futures S&P 500 are up 5 and DOW futures are up 34 (fair value).
Oil prices were up slightly over the last week with WTI futures at $73.57 per barrel and Brent at $78.43 per barrel. A year ago, WTI was at $81, and Brent was at $87 - so WTI oil prices were down 10% year-over-year.
Here is a graph from Gasbuddy.com for nationwide gasoline prices. Nationally prices are at $3.05 per gallon. A year ago, prices were at $3.39 per gallon, so gasoline prices are down $0.34 year-over-year.


