 RSS Feed
 by Calculated Risk on 1/25/2024 10:53:00 AM
Thursday, January 25, 2024
New Home Sales increase to 664,000 Annual Rate in December; Average New Home Price is Down 14% from the Peak
Today, in the Calculated Risk Real Estate Newsletter: New Home Sales increase to 664,000 Annual Rate in December
Brief excerpt:
The Census Bureau reports New Home Sales in December were at a seasonally adjusted annual rate (SAAR) of 664 thousand. The previous three months were revised up, combined.There is much more in the article.
...
The next graph shows new home sales for 2022 and 2023 by month (Seasonally Adjusted Annual Rate). Sales in December 2023 were up 4.4% from December 2022.
Annual new home sales in 2023 were at an estimated 668,000, up 4.2% from 641,000 in 2022.

New Home Sales increase to 664,000 Annual Rate in December
by Calculated Risk on 1/25/2024 10:00:00 AM
The Census Bureau reports New Home Sales in December were at a seasonally adjusted annual rate (SAAR) of 664 thousand.
The previous three months were revised up, combined.
Sales of new single‐family houses in December 2023 were at a seasonally adjusted annual rate of 664,000, according to estimates released jointly today by the U.S. Census Bureau and the Department of Housing and Urban Development. This is 8.0 percent above the revised November rate of 615,000 and is 4.4 percent above the December 2022 estimate of 636,000.
An estimated 668,000 new homes were sold in 2023. This is 4.2 percent above the 2022 figure of 641,000.
emphasis added
 Click on graph for larger image.
The first graph shows New Home Sales vs. recessions since 1963. The dashed line is the current sales rate.
New home sales were close to pre-pandemic levels.
The second graph shows New Home Months of Supply.
 The months of supply decreased in December to 8.2 months from 8.8 months in November.
 The all-time record high was 12.2 months of supply in January 2009. The all-time record low was 3.3 months in August 2020.
This is well above the top of the normal range (about 4 to 6 months of supply is normal).
"The seasonally‐adjusted estimate of new houses for sale at the end of December was 453,000. This represents a supply of 8.2 months at the current sales rate"Sales were above expectations of 650 thousand SAAR, and sales for the three previous months were revised up, combined. I'll have more later today.
BEA: Real GDP increased at 3.3% Annualized Rate in Q4
by Calculated Risk on 1/25/2024 08:31:00 AM
From the BEA: Gross Domestic Product, Fourth Quarter and Year 2023 (Advance Estimate)
Real gross domestic product (GDP) increased at an annual rate of 3.3 percent in the fourth quarter of 2023, according to the "advance" estimate released by the Bureau of Economic Analysis. In the third quarter, real GDP increased 4.9 percent.PCE increased at a 2.8% annual rate, and residential investment increased at a 1.1% rate. The advance Q3 GDP report, with 3.3% annualized increase, was above expectations.
The increase in real GDP reflected increases in consumer spending, exports, state and local government spending, nonresidential fixed investment, federal government spending, private inventory investment, and residential fixed investment (table 2). Imports, which are a subtraction in the calculation of GDP, increased.
The increase in consumer spending reflected increases in both services and goods. Within services, the leading contributors were food services and accommodations as well as health care. Within goods, the leading contributors to the increase were other nondurable goods (led by pharmaceutical products) and recreational goods and vehicles (led by computer software). Within exports, both goods (led by petroleum) and services (led by financial services) increased. The increase in state and local government spending primarily reflected increases in compensation of state and local government employees and investment in structures. The increase in nonresidential fixed investment reflected increases in intellectual property products, structures, and equipment. Within federal government spending, the increase was led by nondefense spending. The increase in inventory investment was led by wholesale trade industries. Within residential fixed investment, the increase reflected an increase in new residential structures that was partly offset by a decrease in brokers' commissions. Within imports, the increase primarily reflected an increase in services (led by travel).
Compared to the third quarter of 2023, the deceleration in real GDP in the fourth quarter primarily reflected slowdowns in private inventory investment, federal government spending, residential fixed investment, and consumer spending. Imports decelerated.
emphasis added
I'll have more later ...
Weekly Initial Unemployment Claims Increase to 214,000
by Calculated Risk on 1/25/2024 08:30:00 AM
The DOL reported:
In the week ending January 20, the advance figure for seasonally adjusted initial claims was 214,000, an increase of 25,000 from the previous week's revised level. The previous week's level was revised up by 2,000 from 187,000 to 189,000. The 4-week moving average was 202,250, a decrease of 1,500 from the previous week's revised average. The previous week's average was revised up by 500 from 203,250 to 203,750.The following graph shows the 4-week moving average of weekly claims since 1971.
emphasis added
 Click on graph for larger image.
The dashed line on the graph is the current 4-week average. The four-week average of weekly unemployment claims decreased to 202,250.
The previous week was revised up.
Weekly claims were above the consensus forecast.
Wednesday, January 24, 2024
Thursday: Q4 GDP, New Home Sales, Unemployment Claims, Durable Goods
by Calculated Risk on 1/24/2024 08:59:00 PM
 Note: Mortgage rates are from MortgageNewsDaily.com and are for top tier scenarios.
Thursday:
• At 8:30 AM ET, Gross Domestic Product, 4th quarter and Year 2023 (Advance estimate). The consensus is that real GDP increased 1.8% annualized in Q4.
• Also at 8:30 AM, The initial weekly unemployment claims report will be released. The consensus is for 200 thousand initial claims, up from 187 thousand last week.
• Also at 8:30 AM, Durable Goods Orders for December. The consensus is for a 0.5% increase in durable goods.
• Also at 8:30 AM, Chicago Fed National Activity Index for December. This is a composite index of other data.
• At 10:00 AM, New Home Sales for December from the Census Bureau. The consensus is for 650 thousand SAAR, up from 590 thousand in November.
• At 11:00 AM, the Kansas City Fed manufacturing survey for January.
January Vehicle Sales Forecast: 15.4 million SAAR, Up 2% YoY
by Calculated Risk on 1/24/2024 06:59:00 PM
From WardsAuto: January U.S. Light-Vehicle Sales Lukewarm; Unusually Strong Increase to Inventory Expected (pay content). Brief excerpt:
There is upside to January’s sales outlook, which could help alleviate excesses, but rising inventory for some vehicles, including electric vehicles, fullsize pickups and SUVs, plus some individual models in other segments, is leading to some Q1 production slowdowns. However, overall inventory remains lean relative to demand, and production for the U.S. market is forecast to continue growing.
emphasis added
 Click on graph for larger image.
This graph shows actual sales from the BEA (Blue), and Wards forecast for January (Red).
On a seasonally adjusted annual rate basis, the Wards forecast of 15.4 million SAAR, would be down 2.7% from last month, and up 2% from a year ago.
ICE: Mortgage Delinquency Rate Increased in December
by Calculated Risk on 1/24/2024 03:56:00 PM
From ICE (formerly Black Knight): ICE First Look at Mortgage Performance: December Delinquencies Rise on Calendar Effects; Foreclosures Approach Two-year Lows
• In large part due to December ending on a Sunday, delaying the processing of payments made on the last day of the month, the national delinquency rate hit 3.57%, up 19 bps from NovemberNote: that last column below is for the same month in 2019 to show the change from pre-pandemic levels.
• Though the rise (+5.6%) was larger than an average December (+1.4%), it was milder than past Sunday-month-end Decembers, which have seen delinquencies jump +9.9% on average
• Serious delinquencies (90+ days past due) rose to 475K, but were still 19% (-108K) below where they were they ended December 2022
• December’s 24K foreclosure starts marked an 18-month low in new activity, with total active foreclosures the lowest since March 2022 (212K), still 25% below (-71K) pre-pandemic levels
• Likewise, the 5.4K foreclosure sales (completions) in December were down -17.2% from November and the fewest since February 2022 – shortly after the end of COVID-era moratoria
• Prepayment activity rose +4.9% to a single month mortality rate of 0.39% on improving interest rates, but prepays remain constrained by both seasonal and affordability pressures
emphasis added
| Black Knight: Percent Loans Delinquent and in Foreclosure Process | ||||
|---|---|---|---|---|
| Dec 2023 | Nov 2023 | Dec 2022 | Dec 2019 | |
| Delinquent | 3.57% | 3.39% | 3.08% | 3.40% |
| In Foreclosure | 0.40% | 0.41% | 0.37% | 0.46% |
| Number of properties: | ||||
| Number of properties that are delinquent, but not in foreclosure: | 1,908,000 | 1,804,000 | 1,653,000 | 1,803,000 |
| Number of properties in foreclosure pre-sale inventory: | 212,000 | 216,000 | 198,000 | 245,000 |
| Total Properties | 2,120,000 | 2,020,000 | 1,850,000 | 2,047,000 |
Final Look at Local Housing Markets in December
by Calculated Risk on 1/24/2024 12:55:00 PM
Today, in the Calculated Risk Real Estate Newsletter: Final Look at Local Housing Markets in December
A brief excerpt:
After the National Association of Realtors® (NAR) releases the monthly existing home sales report, I pick up additional local market data that is reported after the NAR. This is the final look at local markets in December.There is much more in the article.
I’ve added a comparison of active listings, new listings, and closings to the same month in 2019 (for markets with available data). This gives us a sense of the current low level of sales and inventory, and also shows some significant regional differences.
The big stories for December were that existing home sales were at a new cycle low on a seasonally adjusted annual rate basis (SAAR), and new listings were up YoY for the 3rd consecutive month!
...
And a table of December sales.
In December, sales in these markets were down 8.0%. In November, these same markets were down 7.6% YoY Not Seasonally Adjusted (NSA).
Sales in almost all of these markets are down sharply compared to December 2019.
...
It is possible sales will be up year-over-year in January since sales were reported at 4.00 million SAAR in January 2023. The comparison will be more difficult in February.
More local data coming in February for activity in January!

AIA: "Architecture firm billings remain soft to end the year"; Multi-family Billings Decline for 17th Consecutive Month
by Calculated Risk on 1/24/2024 09:31:00 AM
Note: This index is a leading indicator primarily for new Commercial Real Estate (CRE) investment.
From the AIA: ABI December 2023: Architecture firm billings remain soft to end the year
Nearly one third of firms report an uptick in significantly delayed projects over the past six months• Regional averages: Northeast (45.9); South (43.4); Midwest (50.3); West (45.9)
Business conditions at architecture firms remained soft to close out 2023, with an AIA/Deltek Architecture Billings Index (ABI) score of 45.4 for December (any score below 50 indicates declining billings). Billings at firms declined for eight months of the year, with the only growth coming in some spring and summer months. However, clients largely remained interested in at least discussing potential new projects, since inquiries increased every month of the year except one. The value of new design contracts increased for only six months of the year, indicating that while clients were interested in new projects, they were generally less likely to commit to them by signing a contract. In addition, backlogs at firms remained quite strong throughout 2023, despite declining from a record-high peak in 2022. Backlogs at firms stood at an average of 6.7 months in December, indicating that most firms still have a significant amount of work in the pipeline.
Firm billings declined at firms in all regions of the country except the Midwest in December, where billings were essentially flat. Billings declined for all or nearly all months of 2023 at firms located in the West and Northeast. Firms in the South saw growth in the second quarter but otherwise declined. Only firms located in the Midwest reported increasing billings for most of the year, although conditions also softened there by late summer. Business conditions were also weak for most of the year at firms of all specializations, with firms with a multifamily residential specialization experiencing a particularly challenging year. Firms with an institutional specialization reported growth in the second quarter, but billings softened for them as well by the end of the year. Billings were flat throughout much of the year at firms with a commercial/industrial specialization and remained soft to end the year.
emphasis added
• Sector index breakdown: commercial/industrial (46.4); institutional (46.5); multifamily residential (45.8)
 Click on graph for larger image.
This graph shows the Architecture Billings Index since 1996. The index was at 45.4 in December, up from 45.3 in November. Anything below 50 indicates a decrease in demand for architects' services.
Note: This includes commercial and industrial facilities like hotels and office buildings, multi-family residential, as well as schools, hospitals and other institutions.
This index usually leads CRE investment by 9 to 12 months, so this index suggests a slowdown in CRE investment in 2024.
Note that multi-family billing turned down in August 2022 and has been negative for seventeen consecutive months (with revisions). This suggests we will see a further weakness in multi-family starts.
MBA: Mortgage Applications Increased in Weekly Survey
by Calculated Risk on 1/24/2024 07:00:00 AM
From the MBA: Mortgage Applications Increase in Latest MBA Weekly Survey
Mortgage applications increased 3.7 percent from one week earlier, according to data from the Mortgage Bankers Association’s (MBA) Weekly Mortgage Applications Survey for the week ending January 19, 2024. The results include an adjustment to account for the MLK holiday.
The Market Composite Index, a measure of mortgage loan application volume, increased 3.7 percent on a seasonally adjusted basis from one week earlier. On an unadjusted basis, the Index decreased 4 percent compared with the previous week. The holiday adjusted Refinance Index decreased 7 percent from the previous week and was 8 percent lower than the same week one year ago. The unadjusted Refinance Index decreased 16 percent from the previous week and was 8 percent lower than the same week one year ago. The seasonally adjusted Purchase Index increased 8 percent from one week earlier. The unadjusted Purchase Index increased 3 percent compared with the previous week and was 18 percent lower than the same week one year ago.
“Mortgage rates increased slightly last week but, there continues to be an upward trend in purchase activity. Conventional and FHA purchase applications drove most of the increase last week as some buyers moved to act early this season,” said Joel Kan, MBA’s Vice President and Deputy Chief Economist. “Refinance applications declined over the week and remained at low levels. There is still little incentive for homeowners to refinance with rates at these levels.”
...
The average contract interest rate for 30-year fixed-rate mortgages with conforming loan balances ($726,200 or less) increased to 6.78 percent from 6.75 percent, with points increasing to 0.63 from 0.62 (including the origination fee) for 80 percent loan-to-value ratio (LTV) loans.
emphasis added
 Click on graph for larger image.
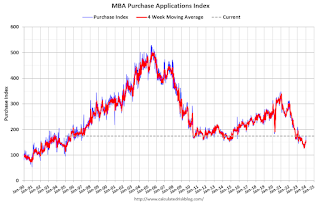
The first graph shows the MBA mortgage purchase index.
According to the MBA, purchase activity is down 18% year-over-year unadjusted.
Red is a four-week average (blue is weekly).
Purchase application activity is up from the lows in late October and early November, but still close to the lowest levels during the housing bust.

The second graph shows the refinance index since 1990.
With higher mortgage rates, the refinance index declined sharply in 2022, and even with some recent increases, activity is barely off the bottom.


