by Calculated Risk on 1/26/2024 08:30:00 AM
Friday, January 26, 2024
Personal Income increased 0.3% in December; Spending increased 0.7%
The BEA released the Personal Income and Outlays report for December:
Personal income increased $60.0 billion (0.3 percent at a monthly rate) in December, according to estimates released today by the Bureau of Economic Analysis. Disposable personal income (DPI), personal income less personal current taxes, increased $51.8 billion (0.3 percent) and personal consumption expenditures (PCE) increased $133.9 billion (0.7 percent).The December PCE price index increased 2.6 percent year-over-year (YoY), unchanged from 2.6 percent YoY in November, and down from the recent peak of 7.0 percent in June 2022.
The PCE price index increased 0.2 percent. Excluding food and energy, the PCE price index increased 0.2 percent. Real DPI increased 0.1 percent in December and real PCE increased 0.5 percent; goods increased 1.1 percent and services increased 0.3 percent
emphasis added
The following graph shows real Personal Consumption Expenditures (PCE) through December 2023 (2017 dollars). Note that the y-axis doesn't start at zero to better show the change.
 Click on graph for larger image.
The dashed red lines are the quarterly levels for real PCE.
Personal income was at expectations, and PCE was well above expectations.
Thursday, January 25, 2024
Friday: Personal Income and Outlays, Pending Home Sales
by Calculated Risk on 1/25/2024 07:55:00 PM

Friday:
• At 8:30 AM ET, Personal Income and Outlays for December. The consensus is for a 0.3% increase in personal income, and for a 0.4% increase in personal spending. And for the Core PCE price index to increase 0.2%. PCE prices are expected to be up 2.6% YoY, and core PCE prices up 3.0% YoY.
• At 10:00 AM, Pending Home Sales Index for December. The consensus is for a 2.0% increase in the index.
Realtor.com Reports Active Inventory UP 8.6% YoY; New Listings up 3.4% YoY
by Calculated Risk on 1/25/2024 02:55:00 PM
Realtor.com has monthly and weekly data on the existing home market. Here is their weekly report: Weekly Housing Trends View — Data Week Ending January 20, 2024
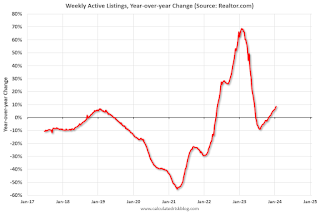
• Active inventory increased, with for-sale homes 8.6% above year ago levels.
Active listings in the past week grew by 8.6% above the previous year, the 11th straight week of annual growth with no sign yet of a slowdown as growth in inventory increased from the previous week’s 7.9% rate. Should the uptick in new listings persist, the added inventory would greatly improve availability and affordability heading into the spring homebuying season but overall inventory is still 37.5% below similar weeks in 2017 to 2020.
• New listings–a measure of sellers putting homes up for sale–were up this week, by 3.4% from one year ago.
Newly listed homes continue to rise above last year’s levels for the 13th week in a row. However, this past week the number of newly listed homes grew by only 3.4% over last year, a slowing down of the 7.0% growth rate seen in the previous week. During the winter season, there is a smaller pool of both home buyers and sellers active in the market, which could lead to more week-to-week fluctuations. Nonetheless, this past week’s new listing count still represents a decline of 25.9% compared to similar weeks in 2017 to 2020.
 Here is a graph of the year-over-year change in inventory according to realtor.com.
 Inventory was up year-over-year for the 11th consecutive week following 20 consecutive weeks with a YoY decrease in inventory.
New Home Sales increase to 664,000 Annual Rate in December; Average New Home Price is Down 14% from the Peak
by Calculated Risk on 1/25/2024 10:53:00 AM
Today, in the Calculated Risk Real Estate Newsletter: New Home Sales increase to 664,000 Annual Rate in December
Brief excerpt:
The Census Bureau reports New Home Sales in December were at a seasonally adjusted annual rate (SAAR) of 664 thousand. The previous three months were revised up, combined.There is much more in the article.
...
The next graph shows new home sales for 2022 and 2023 by month (Seasonally Adjusted Annual Rate). Sales in December 2023 were up 4.4% from December 2022.
Annual new home sales in 2023 were at an estimated 668,000, up 4.2% from 641,000 in 2022.
New Home Sales increase to 664,000 Annual Rate in December
by Calculated Risk on 1/25/2024 10:00:00 AM
The Census Bureau reports New Home Sales in December were at a seasonally adjusted annual rate (SAAR) of 664 thousand.
The previous three months were revised up, combined.
Sales of new single‐family houses in December 2023 were at a seasonally adjusted annual rate of 664,000, according to estimates released jointly today by the U.S. Census Bureau and the Department of Housing and Urban Development. This is 8.0 percent above the revised November rate of 615,000 and is 4.4 percent above the December 2022 estimate of 636,000.
An estimated 668,000 new homes were sold in 2023. This is 4.2 percent above the 2022 figure of 641,000.
emphasis added
 Click on graph for larger image.
The first graph shows New Home Sales vs. recessions since 1963. The dashed line is the current sales rate.
New home sales were close to pre-pandemic levels.
The second graph shows New Home Months of Supply.
 The months of supply decreased in December to 8.2 months from 8.8 months in November.
 The all-time record high was 12.2 months of supply in January 2009. The all-time record low was 3.3 months in August 2020.
This is well above the top of the normal range (about 4 to 6 months of supply is normal).
"The seasonally‐adjusted estimate of new houses for sale at the end of December was 453,000. This represents a supply of 8.2 months at the current sales rate"Sales were above expectations of 650 thousand SAAR, and sales for the three previous months were revised up, combined. I'll have more later today.
BEA: Real GDP increased at 3.3% Annualized Rate in Q4
by Calculated Risk on 1/25/2024 08:31:00 AM
From the BEA: Gross Domestic Product, Fourth Quarter and Year 2023 (Advance Estimate)
Real gross domestic product (GDP) increased at an annual rate of 3.3 percent in the fourth quarter of 2023, according to the "advance" estimate released by the Bureau of Economic Analysis. In the third quarter, real GDP increased 4.9 percent.PCE increased at a 2.8% annual rate, and residential investment increased at a 1.1% rate. The advance Q3 GDP report, with 3.3% annualized increase, was above expectations.
The increase in real GDP reflected increases in consumer spending, exports, state and local government spending, nonresidential fixed investment, federal government spending, private inventory investment, and residential fixed investment (table 2). Imports, which are a subtraction in the calculation of GDP, increased.
The increase in consumer spending reflected increases in both services and goods. Within services, the leading contributors were food services and accommodations as well as health care. Within goods, the leading contributors to the increase were other nondurable goods (led by pharmaceutical products) and recreational goods and vehicles (led by computer software). Within exports, both goods (led by petroleum) and services (led by financial services) increased. The increase in state and local government spending primarily reflected increases in compensation of state and local government employees and investment in structures. The increase in nonresidential fixed investment reflected increases in intellectual property products, structures, and equipment. Within federal government spending, the increase was led by nondefense spending. The increase in inventory investment was led by wholesale trade industries. Within residential fixed investment, the increase reflected an increase in new residential structures that was partly offset by a decrease in brokers' commissions. Within imports, the increase primarily reflected an increase in services (led by travel).
Compared to the third quarter of 2023, the deceleration in real GDP in the fourth quarter primarily reflected slowdowns in private inventory investment, federal government spending, residential fixed investment, and consumer spending. Imports decelerated.
emphasis added
Weekly Initial Unemployment Claims Increase to 214,000
by Calculated Risk on 1/25/2024 08:30:00 AM
The DOL reported:
In the week ending January 20, the advance figure for seasonally adjusted initial claims was 214,000, an increase of 25,000 from the previous week's revised level. The previous week's level was revised up by 2,000 from 187,000 to 189,000. The 4-week moving average was 202,250, a decrease of 1,500 from the previous week's revised average. The previous week's average was revised up by 500 from 203,250 to 203,750.The following graph shows the 4-week moving average of weekly claims since 1971.
emphasis added
 Click on graph for larger image.
The dashed line on the graph is the current 4-week average. The four-week average of weekly unemployment claims decreased to 202,250.
The previous week was revised up.
Weekly claims were above the consensus forecast.
Wednesday, January 24, 2024
Thursday: Q4 GDP, New Home Sales, Unemployment Claims, Durable Goods
by Calculated Risk on 1/24/2024 08:59:00 PM

Thursday:
• At 8:30 AM ET, Gross Domestic Product, 4th quarter and Year 2023 (Advance estimate). The consensus is that real GDP increased 1.8% annualized in Q4.
• Also at 8:30 AM, The initial weekly unemployment claims report will be released. The consensus is for 200 thousand initial claims, up from 187 thousand last week.
• Also at 8:30 AM, Durable Goods Orders for December. The consensus is for a 0.5% increase in durable goods.
• Also at 8:30 AM, Chicago Fed National Activity Index for December. This is a composite index of other data.
• At 10:00 AM, New Home Sales for December from the Census Bureau. The consensus is for 650 thousand SAAR, up from 590 thousand in November.
• At 11:00 AM, the Kansas City Fed manufacturing survey for January.
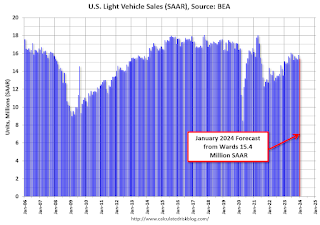
January Vehicle Sales Forecast: 15.4 million SAAR, Up 2% YoY
by Calculated Risk on 1/24/2024 06:59:00 PM
From WardsAuto: January U.S. Light-Vehicle Sales Lukewarm; Unusually Strong Increase to Inventory Expected (pay content). Brief excerpt:
There is upside to January’s sales outlook, which could help alleviate excesses, but rising inventory for some vehicles, including electric vehicles, fullsize pickups and SUVs, plus some individual models in other segments, is leading to some Q1 production slowdowns. However, overall inventory remains lean relative to demand, and production for the U.S. market is forecast to continue growing.
emphasis added
 Click on graph for larger image.
This graph shows actual sales from the BEA (Blue), and Wards forecast for January (Red).
On a seasonally adjusted annual rate basis, the Wards forecast of 15.4 million SAAR, would be down 2.7% from last month, and up 2% from a year ago.
ICE: Mortgage Delinquency Rate Increased in December
by Calculated Risk on 1/24/2024 03:56:00 PM
From ICE (formerly Black Knight): ICE First Look at Mortgage Performance: December Delinquencies Rise on Calendar Effects; Foreclosures Approach Two-year Lows
• In large part due to December ending on a Sunday, delaying the processing of payments made on the last day of the month, the national delinquency rate hit 3.57%, up 19 bps from NovemberNote: that last column below is for the same month in 2019 to show the change from pre-pandemic levels.
• Though the rise (+5.6%) was larger than an average December (+1.4%), it was milder than past Sunday-month-end Decembers, which have seen delinquencies jump +9.9% on average
• Serious delinquencies (90+ days past due) rose to 475K, but were still 19% (-108K) below where they were they ended December 2022
• December’s 24K foreclosure starts marked an 18-month low in new activity, with total active foreclosures the lowest since March 2022 (212K), still 25% below (-71K) pre-pandemic levels
• Likewise, the 5.4K foreclosure sales (completions) in December were down -17.2% from November and the fewest since February 2022 – shortly after the end of COVID-era moratoria
• Prepayment activity rose +4.9% to a single month mortality rate of 0.39% on improving interest rates, but prepays remain constrained by both seasonal and affordability pressures
emphasis added
| Black Knight: Percent Loans Delinquent and in Foreclosure Process | ||||
|---|---|---|---|---|
| Dec 2023 | Nov 2023 | Dec 2022 | Dec 2019 | |
| Delinquent | 3.57% | 3.39% | 3.08% | 3.40% |
| In Foreclosure | 0.40% | 0.41% | 0.37% | 0.46% |
| Number of properties: | ||||
| Number of properties that are delinquent, but not in foreclosure: | 1,908,000 | 1,804,000 | 1,653,000 | 1,803,000 |
| Number of properties in foreclosure pre-sale inventory: | 212,000 | 216,000 | 198,000 | 245,000 |
| Total Properties | 2,120,000 | 2,020,000 | 1,850,000 | 2,047,000 |


