 RSS Feed
 by Calculated Risk on 1/29/2024 02:43:00 PM
Monday, January 29, 2024
Q4 2023 GDP Details on Residential and Commercial Real Estate
The BEA released the underlying details for the Q4 advance GDP report on Friday.
The BEA reported that investment in non-residential structures increased at a 3.2% annual pace in Q4. Investment in petroleum and natural gas structures increased in Q4 compared to Q3 and was up 5% year-over-year.
 Click on graph for larger image.
The first graph shows investment in offices, malls and lodging as a percent of GDP.
Investment in offices (blue) increased slightly in Q4 and was up 5.0% year-over-year. And mostly unchanged as a percent of GDP.
Investment in multimerchandise shopping structures (malls) peaked in 2007 and was up about 8% year-over-year in Q4. The vacancy rate for malls is still very high, so investment will probably stay low for some time.
Lodging investment decreased in Q4 compared to Q3, and lodging investment was up 5% year-over-year.
All three sectors - offices, malls, and hotels - were hurt significantly by the pandemic. And the office vacancy rate is at a record high, and this will push down office investment.
 The second graph is for Residential investment components as a percent of GDP. According to the Bureau of Economic Analysis, RI includes new single-family structures, multifamily structures, home improvement, Brokers’ commissions and other ownership transfer costs, and a few minor categories (dormitories, manufactured homes).
Investment in single family structures was $417 billion (SAAR) (about 1.5% of GDP) and was up 4% year-over-year.
Investment in multi-family structures was up slightly in Q4 to $135 billion (SAAR) from Q3, and up 14% YoY.
Investment in home improvement was at a $345 billion (SAAR) in Q4 (about 1.2% of GDP). Home improvement spending was strong during the pandemic but has declined as a percent of GDP recently.
Note that Brokers' commissions (black) increased sharply as existing home sales increased in the second half of 2020 but declined when mortgage rates increased. Brokers' commissions were down 5% year-over-year in Q4.
Las Vegas December 2023: Visitor Traffic Up 3% YoY; Convention Traffic Down 11%
by Calculated Risk on 1/29/2024 11:54:00 AM
From the Las Vegas Visitor Authority: December 2023 Las Vegas Visitor Statistics
Closing out the year with roughly 3.4M visitors in December, Las Vegas ended 2023 with annual visitation of 40.8M visitors, +5.2% ahead of 2022.
As the convention/group segment strengthened over 2022, annual est. convention attendance neared 6.0M in 2023, roughly 20% ahead of 2022's 5.0M tally.
2023 annual hotel occupancy reached 83.5%, +4.3 pts YoY, as Weekend occupancy reached 90.7% (+1.4 pts YoY) while Midweek occupancy improved to 80.3% for the year, +5.6 pts YoY.
Annual ADR for 2023 surpassed $191, beating last year by 11.9% while RevPAR neared $160, up 18% vs. 2022.
emphasis added
 Click on graph for larger image.
 The first graph shows visitor traffic for 2019 (Black), 2020 (light blue), 2021 (purple), 2022 (orange), and 2023 (red).
Visitor traffic was up 2.7% compared to last December. For all of 2023, visitor traffic was up 5.2% compared to 2022. Visitor traffic was down 2.0% compared to the same month in 2019.
The second graph shows convention traffic.
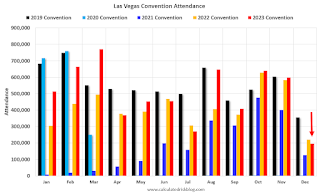
Convention traffic was down 11.0% compared to December 2022, and down 4.5% compared to November 2019. 
For all of 2023, convention traffic was up 19.9% compared to 2022.
Note: There was almost no convention traffic from April 2020 through May 2021.
Note: There was almost no convention traffic from April 2020 through May 2021.
Housing January 29th Weekly Update: Inventory Down 0.6% Week-over-week, Up 7.9% Year-over-year
by Calculated Risk on 1/29/2024 08:21:00 AM
Altos reports that active single-family inventory was down 0.6% week-over-week. Inventory will likely decrease a little seasonally until the Spring (it could remain mostly flat for a few months like in 2019).
 Click on graph for larger image.
This inventory graph is courtesy of Altos Research.
As of January 26th, inventory was at 503 thousand (7-day average), compared to 506 thousand the prior week.
Inventory is still far below pre-pandemic levels.

The red line is for 2024. The black line is for 2019. Note that inventory is up 85% from the record low for the same week in 2022, but still well below normal levels.
Inventory was up 7.9% compared to the same week in 2023 (last week it was up 7.1%), and down 39.2% compared to the same week in 2019 (last week down 38.6%).
Back in June 2023, inventory was down almost 54% compared to 2019, so the gap to more normal inventory levels has closed a little.
Mike Simonsen discusses this data regularly on Youtube.
Sunday, January 28, 2024
Sunday Night Futures
by Calculated Risk on 1/28/2024 06:16:00 PM
Weekend:
• Schedule for Week of January 28, 2024
• FOMC Preview: No Change to Policy Expected
Monday:
• 10:30 AM: Dallas Fed Survey of Manufacturing Activity for January. This is the last of the regional Fed manufacturing surveys for January.
From CNBC: Pre-Market Data and Bloomberg futures S&P 500 are down 11 and DOW futures are down 91 (fair value).
Oil prices were up over the last week with WTI futures at $78.01 per barrel and Brent at $83.55 per barrel. A year ago, WTI was at $80, and Brent was at $85 - so WTI oil prices were down slightly year-over-year.
Here is a graph from Gasbuddy.com for nationwide gasoline prices. Nationally prices are at $3.09 per gallon. A year ago, prices were at $3.50 per gallon, so gasoline prices are down $0.41 year-over-year.
FOMC Preview: No Change to Policy Expected
by Calculated Risk on 1/28/2024 08:31:00 AM
Most analysts expect there will be no change to FOMC policy at the meeting this week, keeping the target range for the federal funds rate at 5‑1/4 to 5-1/2 percent.
Currently the market expects the next Fed move to be a 25 bp cut announced at either the March or May FOMC meeting. The market is pricing in a 2nd cut in June - and a total of around 5 cuts in 2024.
Based on the recent inflation reports, the FOMC will likely hint at a possible first rate cut in March. Also, Fed Chair Powell might note that the FOMC has started to discuss when to slow balance sheet runoff.
From Goldman Sachs:
1 Projections of change in real GDP and inflation are from the fourth quarter of the previous year to the fourth quarter of the year indicated.
The unemployment rate was at 3.7% in December and averaged just under 3.8% for Q4. The FOMC's unemployment rate projection for Q4 was close.
2 Projections for the unemployment rate are for the average civilian unemployment rate in the fourth quarter of the year indicated.
As of December 2023, PCE inflation increased 2.6 percent year-over-year (YoY). On a Q4-over-Q4 basis, PCE inflation increased 2.6%, lower than the December projection.
PCE core inflation increased 2.9 percent YoY in December. On a Q4-over-Q4 basis, PCE inflation increased 3.0%, lower than the December projection.
"The FOMC will likely aim to keep a March cut on the table without sending a decisive signal by removing the outdated hiking bias from its statement and noting that future policy changes will depend on upcoming inflation and other data."
Projections will not be released at this meeting. For review, here are the December projections. Since the last projections were released, the economy has performed better than the FOMC expected, and inflation was lower than expected.
The BEA reported real GDP increased 3.1% Q4 over Q4 in 2023. This was solidly above the December projections.
| GDP projections of Federal Reserve Governors and Reserve Bank presidents, Change in Real GDP1 | ||||
|---|---|---|---|---|
| Projection Date | 2023 | 2024 | 2025 | 2026 |
| Dec 2023 | 2.5 to 2.7 | 1.2 to 1.7 | 1.5 to 2.0 | 1.8 to 2.0 |
| Sept 2023 | 1.9 to 2.2 | 1.2 to 1.8 | 1.6 to 2.0 | 1.7 to 2.0 |
The unemployment rate was at 3.7% in December and averaged just under 3.8% for Q4. The FOMC's unemployment rate projection for Q4 was close.
| Unemployment projections of Federal Reserve Governors and Reserve Bank presidents, Unemployment Rate2 | ||||
|---|---|---|---|---|
| Projection Date | 2023 | 2024 | 2025 | 2026 |
| Dec 2023 | 3.8 | 4.0 to 4.2 | 4.0 to 4.2 | 3.9 to 4.3 |
| Sept 2023 | 3.7 to 3.9 | 3.9 to 4.4 | 3.9 to 4.3 | 3.8 to 4.3 |
As of December 2023, PCE inflation increased 2.6 percent year-over-year (YoY). On a Q4-over-Q4 basis, PCE inflation increased 2.6%, lower than the December projection.
| Inflation projections of Federal Reserve Governors and Reserve Bank presidents, PCE Inflation1 | ||||
|---|---|---|---|---|
| Projection Date | 2023 | 2024 | 2025 | 2026 |
| Dec 2023 | 2.7 to 2.9 | 2.2 to 2.5 | 2.0 to 2.2 | 2.0 |
| Sept 2023 | 3.2 to 3.4 | 2.3 to 2.7 | 2.0 to 2.3 | 2.0 to 2.2 |
PCE core inflation increased 2.9 percent YoY in December. On a Q4-over-Q4 basis, PCE inflation increased 3.0%, lower than the December projection.
Over the last 6 months, the PCE Price Index increase 2.0% annualized, the core PCE price index increased at a 1.9% annual rate, and core PCE minus Housing increased 1.1% annualized suggesting that 2024 projections are too high.
| Core Inflation projections of Federal Reserve Governors and Reserve Bank presidents, Core Inflation1 | ||||
|---|---|---|---|---|
| Projection Date | 2023 | 2024 | 2025 | 2026 |
| Dec 2023 | 3.2 to 3.3 | 2.4 to 2.7 | 2.0 to 2.2 | 2.0 to 2.1 |
| Sept 2023 | 3.6 to 3.9 | 2.5 to 2.8 | 2.0 to 2.4 | 2.0 to 2.3 |
Saturday, January 27, 2024
Real Estate Newsletter Articles this Week: New Home Sales increase to 664,000 Annual Rate
by Calculated Risk on 1/27/2024 02:11:00 PM
At the Calculated Risk Real Estate Newsletter this week:
• New Home Sales increase to 664,000 Annual Rate in December
• NMHC: "Apartment Market Continues to Loosen"
• 1.54 million Total Housing Completions in 2023 including Manufactured Homes; Most Since 2007
• Final Look at Local Housing Markets in December
This is usually published 4 to 6 times a week and provides more in-depth analysis of the housing market.
Schedule for Week of January 28, 2024
by Calculated Risk on 1/27/2024 08:11:00 AM
The key reports scheduled for this week are the January employment report and November Case-Shiller house prices.
Other key indicators include the January ISM manufacturing index and January vehicle sales.
The FOMC meets this week, and no change to policy is expected.
10:30 AM: Dallas Fed Survey of Manufacturing Activity for January. This is the last of the regional Fed manufacturing surveys for January.
9:00 AM: FHFA House Price Index for November. This was originally a GSE only repeat sales, however there is also an expanded index.
 9:00 AM ET: S&P/Case-Shiller House Price Index for November.
This graph shows the Year over year change in the nominal seasonally adjusted National Index, Composite 10 and Composite 20 indexes through the most recent report (the Composite 20 was started in January 2000).
The consensus is for a 5.8% year-over-year increase.
 10:00 AM ET: Job Openings and Labor Turnover Survey for December from the BLS.
 This graph shows job openings (black line), hires (purple), Layoff, Discharges and other (red column), and Quits (light blue column) from the JOLTS.
Jobs openings decreased in November to 8.79 million from 8.85 million in October.
10:00 AM: The Q4 Housing Vacancies and Homeownership report from the Census Bureau.
7:00 AM ET: The Mortgage Bankers Association (MBA) will release the results for the mortgage purchase applications index.
8:15 AM: The ADP Employment Report for January. This report is for private payrolls only (no government). The consensus is for 130,000 payroll jobs added in January, down from 164,000 added in December.
9:45 AM: Chicago Purchasing Managers Index for January. The consensus is for a reading of 48.0, up from 46.9 in December.
2:00 PM: FOMC Meeting Announcement. No change to policy is expected.
2:30 PM: Fed Chair Jerome Powell holds a press briefing following the FOMC announcement.
8:30 AM: The initial weekly unemployment claims report will be released. The consensus is for 210 thousand initial claims, down from 214 thousand last week.
10:00 AM: Construction Spending for December. The consensus is for a 0.5% increase in construction spending.
10:00 AM: ISM Manufacturing Index for January. The consensus is for the ISM to be at 47.3, down from 47.4 in December.
 8:30 AM: Employment Report for December. The consensus is for 162,000 jobs added, and for the unemployment rate to increase to 3.8%.
There were 216,000 jobs added in December, and the unemployment rate was at 3.7%.
This graph shows the jobs added per month since January 2021.
10:00 AM: University of Michigan's Consumer sentiment index (Preliminary for January).
 All day: Light vehicle sales for January. Sales were at 15.8 million in December (Seasonally Adjusted Annual Rate).
This graph shows light vehicle sales since the BEA started keeping data in 1967. The dashed line is the December sales rate.
Friday, January 26, 2024
Jan 26th COVID Update: Weekly Deaths Increased
by Calculated Risk on 1/26/2024 07:02:00 PM
 Note: Mortgage rates are from MortgageNewsDaily.com and are for top tier scenarios.
Due to changes at the CDC, weekly cases are no longer updated.
For deaths, I'm currently using 4 weeks ago for "now", since the most recent three weeks will be revised significantly.
Hospitalizations have more than quadrupled from a low of 5,150 in June 2023.
Hospitalizations are less than 20% of the peak of 150,000 in January 2022.
| COVID Metrics | ||||
|---|---|---|---|---|
| Now | Week Ago | Goal | ||
| Hospitalized2 | 24,718 | 28,154 | ≤3,0001 | |
| Deaths per Week2🚩 | 1,978 | 1,806 | ≤3501 | |
| 1my goals to stop weekly posts, 2Weekly for Currently Hospitalized, and Deaths 🚩 Increasing number weekly for Hospitalized and Deaths ✅ Goal met. | ||||
 Click on graph for larger image.
This graph shows the weekly (columns) number of deaths reported.
Weekly deaths have more than quadrupled from a low of 485 in early July. Still weekly deaths are far below the weekly peak of 26,000 in January 2021.
 This appears to be a leading indicator for COVID hospitalizations and deaths.
COVID in wastewater is now off about 40% of the holiday peak at the end of December, and that suggests weekly deaths will start to decrease soon.
U.S. Courts: Bankruptcy Filings Increase 17 Percent in 2023; 42% Below Pre-Pandemic Levels
by Calculated Risk on 1/26/2024 12:59:00 PM
From the U.S. Courts: Bankruptcy Filings Rise 16.8 Percent
Total bankruptcy filings rose 16.8 percent, with significant increases in both business and non-business bankruptcies, in the twelve-month period ending Dec. 31, 2023. This accelerates a continuing rebound in filings after more than a decade of sharply dropping totals.
According to statistics released by the Administrative Office of the U.S. Courts, annual bankruptcy filings totaled 452,990 in the year ending December 2023, compared with 387,721 cases in the previous year.
Business filings rose 40.4 percent, from 13,481 to 18,926, in the year ending Dec. 31, 2023. Non-business bankruptcy filings rose 16 percent to 434,064, compared with 374,240 in December 2022.
Bankruptcy totals for the previous 12 months are reported four times annually.
This is the fourth straight quarter that total bankruptcy filings have risen, following a decade-plus decline. Bankruptcies fell especially sharply after the pandemic began in early 2020, despite some COVID-related disruptions to the economy.
Despite the recent increases, the newest totals remain far lower than in December 2010, when filings peaked at just less than 1.6 million.
 Click on graph for larger image.
This graph shows the business and non-business bankruptcy filings by calendar year since 1997.
The sharp decline in 2006 was due to the so-called "Bankruptcy Abuse Prevention and Consumer Protection Act of 2005".
2023 was the 3rd lowest year for bankruptcy filings, and 42% below the pre-pandemic level in 2019.
NAR: Pending Home Sales Increase 8.3% December; Up 1.3% Year-over-year
by Calculated Risk on 1/26/2024 10:00:00 AM
From the NAR: Pending Home Sales Climbed 8.3% in December
Pending home sales in December elevated 8.3%, according to the National Association of REALTORS®. The Midwest, South and West posted monthly gains in transactions while the Northeast recorded a loss. The Midwest, South and West also registered year-over-year increases while the Northeast had a decline in transactions compared to last year.This was well above expectations. Note: Contract signings usually lead sales by about 45 to 60 days, so this would usually be for closed sales in January and February.
The Pending Home Sales Index (PHSI)* – a forward-looking indicator of home sales based on contract signings – increased to 77.3 in December. Year over year, pending transactions were up 1.3%. An index of 100 is equal to the level of contract activity in 2001.
...
The Northeast PHSI dropped 3.0% from last month to 62.3, a decline of 3.9% from December 2022. The Midwest index increased 5.6% to 80.5 in December, up 4.3% from one year ago.
The South PHSI jumped 11.9% to 93.0 in December, rising 1.5% from the prior year. The West index surged 14.0% in December to 61.0, up 1.5% from December 2022.
emphasis added


