by Calculated Risk on 2/02/2024 09:28:00 AM
Friday, February 02, 2024
Comments on January Employment Report
This was a very strong report; however, the benchmark revision showed job growth was slower over the last year than originally reported. Including revisions: The 3.06 million jobs added in 2023 was the 17th best year for job growth in US history (out of 84 years) following the two best years on record (2021 and 2022).
The headline jobs number in the January employment report was well above expectations, and November and December payrolls were revised up by 126,000 combined. The participation rate was unchanged, the employment population ratio increased, and the unemployment rate was unchanged at 3.7%.
Prime (25 to 54 Years Old) Participation
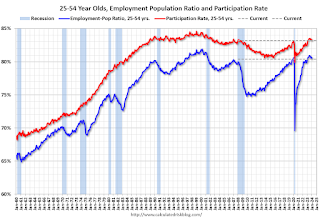 Since the overall participation rate is impacted by both cyclical (recession) and demographic (aging population, younger people staying in school) reasons, here is the employment-population ratio for the key working age group: 25 to 54 years old.
The 25 to 54 years old participation rate increased in January to 83.3% from 83.2% in December, and the 25 to 54 employment population ratio increased to 80.6% from 80.4% the previous month.
Average Hourly Wages
 The graph shows the nominal year-over-year change in "Average Hourly Earnings" for all private employees from the Current Employment Statistics (CES).
 Wage growth has mostly trended down after peaking at 5.9% YoY in March 2022 and was at 4.5% YoY in January.
Part Time for Economic Reasons
 From the BLS report:
"In January, the number of people employed part time for economic reasons, at 4.4 million, changed little. These individuals, who would have preferred full-time employment, were working part time because their hours had been reduced or they were unable to find full-time jobs."The number of persons working part time for economic reasons increased in January to 4.42 million from 4.21 million in December. This is slightly above pre-pandemic levels.
These workers are included in the alternate measure of labor underutilization (U-6) that increased to 7.2% from 7.1% in the previous month. This is down from the record high in April 2020 of 23.0% and up from the lowest level on record (seasonally adjusted) in December 2022 (6.5%). (This series started in 1994). This measure is close to the 7.0% level in February 2020 (pre-pandemic).
Unemployed over 26 Weeks
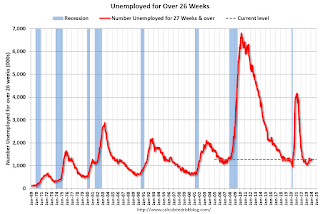 This graph shows the number of workers unemployed for 27 weeks or more.
 According to the BLS, there are 1.277 million workers who have been unemployed for more than 26 weeks and still want a job, up from 1.245 million the previous month.
This is close to pre-pandemic levels.
Job Streak
| Headline Jobs, Top 10 Streaks | ||
|---|---|---|
| Year Ended | Streak, Months | |
| 1 | 2019 | 100 |
| 2 | 1990 | 48 |
| 3 | 2007 | 46 |
| 4 | 1979 | 45 |
| 5 | 20241 | 37 |
| 6 tie | 1943 | 33 |
| 6 tie | 1986 | 33 |
| 6 tie | 2000 | 33 |
| 9 | 1967 | 29 |
| 10 | 1995 | 25 |
| 1Currrent Streak | ||
Summary:
The headline monthly jobs number was well above consensus expectations, and November and December payrolls were revised up by 126,000 combined. The annual benchmark revision indicated job growth was lower than originally reported. The participation rate was unchanged, the employment population ratio increased, and the unemployment rate was unchanged at 3.7%.
January Employment Report: 353 thousand Jobs, 3.7% Unemployment Rate
by Calculated Risk on 2/02/2024 08:30:00 AM
From the BLS:
Total nonfarm payroll employment rose by 353,000 in January, and the unemployment rate remained at 3.7 percent, the U.S. Bureau of Labor Statistics reported today. Job gains occurred in professional and business services, health care, retail trade, and social assistance. Employment declined in the mining, quarrying, and oil and gas extraction industry.
...
The change in total nonfarm payroll employment for November was revised up by 9,000, from +173,000 to +182,000, and the change for December was revised up by 117,000, from +216,000 to +333,000. With these revisions, employment in November and December combined is 126,000 higher than previously reported.
emphasis added
 Click on graph for larger image.
The first graph shows the jobs added per month since January 2021.
Payrolls for November and December were revised up 126 thousand, combined.
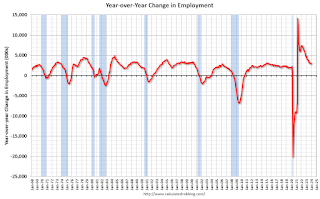 The second graph shows the year-over-year change in total non-farm employment since 1968.
In January, the year-over-year change was 2.93 million jobs. Employment was up solidly year-over-year.
The third graph shows the employment population ratio and the participation rate.
 The Labor Force Participation Rate was unchanged at 62.5% in January, from 62.5% in December. This is the percentage of the working age population in the labor force.
 The Employment-Population ratio increased to 60.2% from 60.41% (blue line).
I'll post the 25 to 54 age group employment-population ratio graph later.
 The fourth graph shows the unemployment rate.
 The unemployment rate was unchanged at 3.7% in January from 3.7% in December.
This was well above consensus expectations and November and December payrolls were revised up by 126,000 combined.
The seasonally adjusted total nonfarm employment level for March 2023 was revised downward by 266,000. On a not seasonally adjusted basis, the total nonfarm employment level for March 2023 was revised downward by 187,000, or -0.1 percent. Not seasonally adjusted, the absolute average benchmark revision over the past 10 years is 0.1 percent.I'll have more later ...
Thursday, February 01, 2024
Friday: Employment Report
by Calculated Risk on 2/01/2024 08:39:00 PM

Friday:
• At 8:30 AM ET, 8:30 AM: Employment Report for December. The consensus is for 162,000 jobs added, and for the unemployment rate to increase to 3.8%.
• At 10:00 AM, University of Michigan's Consumer sentiment index (Preliminary for January).
Vehicles Sales Decrease to 15.0 million SAAR in January; Down 1% YoY
by Calculated Risk on 2/01/2024 05:05:00 PM
Wards Auto released their estimate of light vehicle sales for January: U.S. Light-Vehicle Sales Soften in January After December's Strength (pay site).
Causes for the month’s weaker results could have included some payback for December’s surge. However, affordability and inventory likely played roles, as availability remains well below historically normal levels for a market running at a 15-million-plus annualized rate, and at the same time interest rates for financing purchases are at long-time highs, the mix on dealer lots is weighted toward higher priced vehicles.
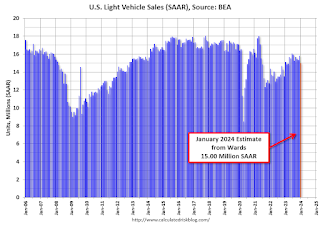 Click on graph for larger image.
This graph shows light vehicle sales since 2006 from the BEA (blue) and Wards Auto's estimate for January (red).
Sales in January (15.0 million SAAR) were down 5.2% from December, and down 0.7% from January 2023.
 Vehicle sales are usually a transmission mechanism for Federal Open Market Committee (FOMC) policy, although far behind housing. This time vehicle sales were more suppressed by supply chain issues and are up year-over-year.
Sales in January were below the consensus forecast.
Realtor.com Reports Active Inventory UP 10.1% YoY; New Listings up 2.1% YoY
by Calculated Risk on 2/01/2024 04:53:00 PM
Realtor.com has monthly and weekly data on the existing home market. Here is their weekly report: Weekly Housing Trends View — Data Week Ending January 27, 2024
• Active inventory increased, with for-sale homes 10.1% above year ago levels. For a 12th consecutive week, active listings registered above prior year level, which means that today’s home shoppers have more homes to choose from that aren’t already in the process of being sold. The added inventory has certainly improved conditions from this time one year ago, but overall inventory is still low. For the month as a whole, January inventory is down nearly 40% below 2017 to 2019 levels..
• New listings–a measure of sellers putting homes up for sale–were up this week, by 2.1% from one year ago. Newly listed homes were above last year’s levels for the 14th week in a row. While the jump was not as big as seen in recent weeks, further improvement in new listings will help contribute to a recovery in active listings meaning more options for home shoppers.
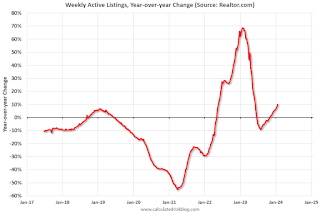 Here is a graph of the year-over-year change in inventory according to realtor.com.
 Inventory was up year-over-year for the 12th consecutive week following 20 consecutive weeks with a YoY decrease in inventory.
January Employment Preview
by Calculated Risk on 2/01/2024 04:30:00 PM
On Friday at 8:30 AM ET, the BLS will release the employment report for January. The consensus is for 162,000 jobs added, and for the unemployment rate to increase to 3.8%.
There were 216,000 jobs added in December, and the unemployment rate was at 3.7%.
• ADP Report: The ADP employment report showed 107,000 private sector jobs were added in January. This suggests job gains below consensus expectations, however, in general, ADP hasn't been very useful in forecasting the BLS report.
• ISM Surveys: Note that the ISM services are diffusion indexes based on the number of firms hiring (not the number of hires). The ISM® manufacturing employment index decreased in January to 47.1%, down from 47.5% last month. This would suggest about 30,000 jobs lost in manufacturing. The ADP report indicated 2,000 manufacturing jobs added in January.
The ISM® services employment index will be released after the employment report.
• Unemployment Claims: The weekly claims report showed a smaller number of initial unemployment claims during the reference week from 203,000 in December to 189,000 in January. This suggests fewer layoffs in January compared to December.
Inflation Adjusted House Prices 2.3% Below Peak; Price-to-rent index is 7.0% below recent peak
by Calculated Risk on 2/01/2024 12:37:00 PM
Today, in the Calculated Risk Real Estate Newsletter: https://calculatedrisk.substack.com/p/inflation-adjusted-house-prices-23-56a
Excerpt:
It has been over 17 years since the bubble peak. In the November Case-Shiller house price index released yesterday, the seasonally adjusted National Index (SA), was reported as being 70% above the bubble peak in 2006. However, in real terms, the National index (SA) is about 10% above the bubble peak (and historically there has been an upward slope to real house prices). The composite 20, in real terms, is 1% above the bubble peak.
People usually graph nominal house prices, but it is also important to look at prices in real terms. As an example, if a house price was $300,000 in January 2010, the price would be $425,000 today adjusted for inflation (41.5% increase). That is why the second graph below is important - this shows "real" prices.
The third graph shows the price-to-rent ratio, and the fourth graph is the affordability index. The last graph shows the 5-year real return based on the Case-Shiller National Index.
...
The second graph shows the same two indexes in real terms (adjusted for inflation using CPI).
In real terms (using CPI), the National index is 2.3% below the recent peak, and the Composite 20 index is 3.2% below the recent peak in 2022.
In real terms, national house prices are 10.4% above the bubble peak levels. There is an upward slope to real house prices, and it has been over 17 years since the previous peak, but real prices are historically high.
Construction Spending Increased 0.9% in December
by Calculated Risk on 2/01/2024 10:20:00 AM
From the Census Bureau reported that overall construction spending increased:
Construction spending during December 2023 was estimated at a seasonally adjusted annual rate of $2,096.0 billion, 0.9 percent above the revised November estimate of $2,078.3 billion. The December figure is 13.9 percent above the December 2022 estimate of $1,840.9 billion.Both private and public spending increased:
The value of construction in 2023 was $1,978.7 billion, 7.0 percent above the $1,848.7 billion spent in 2022.
emphasis added
Spending on private construction was at a seasonally adjusted annual rate of $1,619.7 billion, 0.7 percent above the revised November estimate of $1,608.0 billion. ...
In December, the estimated seasonally adjusted annual rate of public construction spending was $476.3 billion, 1.3 percent above the revised November estimate of $470.3 billion.
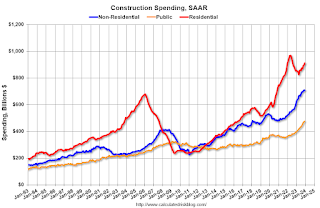 Click on graph for larger image.
This graph shows private residential and nonresidential construction spending, and public spending, since 1993. Note: nominal dollars, not inflation adjusted.
Residential (red) spending is 6.0% below the recent peak.
Non-residential (blue) spending is slightly below the peak in the previous month.
Public construction spending is at a new peak.
 The second graph shows the year-over-year change in construction spending.
On a year-over-year basis, private residential construction spending is up 6.8%. Non-residential spending is up 19.1% year-over-year. Public spending is up 21.3% year-over-year.
ISM® Manufacturing index Increased to 49.1% in January
by Calculated Risk on 2/01/2024 10:00:00 AM
(Posted with permission). The ISM manufacturing index indicated contraction. The PMI® was at 49.1% in January, up from 47.1% in December. The employment index was at 47.1%, down from 47.5% the previous month, and the new orders index was at 52.5%, up from 47.0%.
From ISM: Manufacturing PMI® at 49.1% January 2024 Manufacturing ISM® Report On Business®
Economic activity in the manufacturing sector contracted in January for the 15th consecutive month following one month of “unchanged” status (a PMI® reading of 50 percent) and 28 months of growth prior to that, say the nation's supply executives in the latest Manufacturing ISM® Report On Business®.This suggests manufacturing contracted slightly in January. This was above the consensus forecast.
The report was issued today by Timothy R. Fiore, CPSM, C.P.M., Chair of the Institute for Supply Management® (ISM®) Manufacturing Business Survey Committee:
“The Manufacturing PMI® registered 49.1 percent in January, up 2 percentage points from the seasonally adjusted 47.1 percent recorded in December. The overall economy continued in expansion for the 45th month after one month of contraction in April 2020. (A Manufacturing PMI® above 42.5 percent, over a period of time, generally indicates an expansion of the overall economy.) The New Orders Index moved into expansion territory at 52.5 percent, 5.5 percentage points higher than the seasonally adjusted figure of 47 percent recorded in December. The January reading of the Production Index (50.4 percent) is 0.5 percentage point higher than December’s seasonally adjusted figure of 49.9 percent. The Prices Index registered 52.9 percent, up 7.7 percentage points compared to the reading of 45.2 percent in December. The Backlog of Orders Index registered 44.7 percent, 0.6 percentage point lower than the 45.3 percent recorded in December. The Employment Index registered 47.1 percent, down 0.4 percentage point from December’s seasonally adjusted figure of 47.5 percent.
emphasis added
Weekly Initial Unemployment Claims Increase to 224,000
by Calculated Risk on 2/01/2024 08:30:00 AM
The DOL reported:
In the week ending January 27, the advance figure for seasonally adjusted initial claims was 224,000, an increase of 9,000 from the previous week's revised level. The previous week's level was revised up by 1,000 from 214,000 to 215,000. The 4-week moving average was 207,750, an increase of 5,250 from the previous week's revised average. The previous week's average was revised up by 250 from 202,250 to 202,500.The following graph shows the 4-week moving average of weekly claims since 1971.
emphasis added
 Click on graph for larger image.
The dashed line on the graph is the current 4-week average. The four-week average of weekly unemployment claims increased to 207,750.
The previous week was revised up.
Weekly claims were above the consensus forecast.


