by Calculated Risk on 2/05/2024 08:12:00 AM
Monday, February 05, 2024
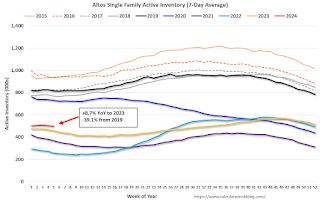
Housing February 5th Weekly Update: Inventory Down 1.2% Week-over-week, Up 8.7% Year-over-year
 Click on graph for larger image.
This inventory graph is courtesy of Altos Research.
Sunday, February 04, 2024
Sunday Night Futures
by Calculated Risk on 2/04/2024 07:07:00 PM
Weekend:
• Schedule for Week of February 4, 2024
Monday:
• At 10:00 AM ET, ISM Services Index for January.
• At 2:00 PM, Senior Loan Officer Opinion Survey on Bank Lending Practices (SLOOS).
From CNBC: Pre-Market Data and Bloomberg futures S&P 500 and DOW futures are mostly unchanged (fair value).
Oil prices were down over the last week with WTI futures at $72.85 per barrel and Brent at $78.00 per barrel. A year ago, WTI was at $73, and Brent was at $79 - so WTI oil prices were mostly unchanged year-over-year.
Here is a graph from Gasbuddy.com for nationwide gasoline prices. Nationally prices are at $3.12 per gallon. A year ago, prices were at $3.44 per gallon, so gasoline prices are down $0.32 year-over-year.
Heavy Truck Sales Increased in January
by Calculated Risk on 2/04/2024 09:04:00 AM
This graph shows heavy truck sales since 1967 using data from the BEA. The dashed line is the January 2024 seasonally adjusted annual sales rate (SAAR).
Heavy truck sales really collapsed during the great recession, falling to a low of 180 thousand SAAR in May 2009. Then heavy truck sales increased to a new record high of 570 thousand SAAR in April 2019.
 Click on graph for larger image.
Note: "Heavy trucks - trucks more than 14,000 pounds gross vehicle weight."
Heavy truck sales declined sharply at the beginning of the pandemic, falling to a low of 308 thousand SAAR in May 2020.
 The second graph shows light vehicle sales since the BEA started keeping data in 1967. Vehicle sales were at 15.00 million SAAR in January, down 6.9% from 16.12 million in December, and down 0.7% from 15.11 million in January 2023.
Saturday, February 03, 2024
Real Estate Newsletter Articles this Week: Case-Shiller National House Price Index Up 5.1% YoY
by Calculated Risk on 2/03/2024 02:11:00 PM
At the Calculated Risk Real Estate Newsletter this week:
• Case-Shiller: National House Price Index Up 5.1% year-over-year in November
• Inflation Adjusted House Prices 2.3% Below Peak
• Asking Rents Mostly Unchanged Year-over-year
• Fannie and Freddie: Single Family Serious Delinquency Rate Increased Slightly, Multi-family Unchanged in December
• Freddie Mac House Price Index Increased in December; Up 6.6% Year-over-year
This is usually published 4 to 6 times a week and provides more in-depth analysis of the housing market.
Schedule for Week of February 4, 2024
by Calculated Risk on 2/03/2024 08:11:00 AM
This will be light week for economic data.
10:00 AM: ISM Services Index for January.
2:00 PM: Senior Loan Officer Opinion Survey on Bank Lending Practices (SLOOS).
8:00 AM ET: Corelogic House Price index for December.
11:00 AM: NY Fed: Q4 Quarterly Report on Household Debt and Credit
7:00 AM ET: The Mortgage Bankers Association (MBA) will release the results for the mortgage purchase applications index.
 8:30 AM: Trade Balance report for December from the Census Bureau.
 This graph shows the U.S. trade deficit, with and without petroleum, through the most recent report. The blue line is the total deficit, and the black line is the petroleum deficit, and the red line is the trade deficit ex-petroleum products.
The consensus is the trade deficit to be $62.3 billion. The U.S. trade deficit was at $63.2 billion in November.
8:30 AM: The initial weekly unemployment claims report will be released. The consensus is for 220 thousand initial claims, down from 224 thousand last week.
8:30 AM: Updated Seasonal Factors for CPI (January 2019 through December 2023)
Friday, February 02, 2024
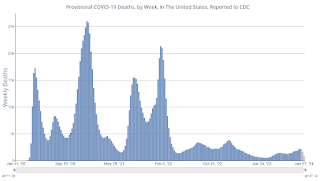
Feb 2nd COVID Update: Weekly Deaths Increased
by Calculated Risk on 2/02/2024 07:02:00 PM
| COVID Metrics | ||||
|---|---|---|---|---|
| Now | Week Ago | Goal | ||
| Hospitalized2 | 21,659 | 25,041 | ≤3,0001 | |
| Deaths per Week2🚩 | 2,258 | 2,076 | ≤3501 | |
| 1my goals to stop weekly posts, 2Weekly for Currently Hospitalized, and Deaths 🚩 Increasing number weekly for Hospitalized and Deaths ✅ Goal met. | ||||
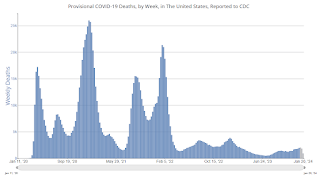 Click on graph for larger image.
This graph shows the weekly (columns) number of deaths reported.
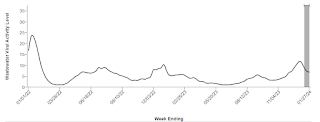 This appears to be a leading indicator for COVID hospitalizations and deaths.
Early GDP Tracking: Solid Start for Q1
by Calculated Risk on 2/02/2024 03:18:00 PM
From Goldman:
We left our Q1 GDP tracking estimate unchanged on net at +2.8% (qoq ar) and our Q1 domestic final sales estimate also unchanged at +3.2%. [Feb 2nd estimate]emphasis addedAnd from the Altanta Fed: GDPNow
The GDPNow model estimate for real GDP growth (seasonally adjusted annual rate) in the first quarter of 2024 is 4.2 percent on February 1, up from 3.0 percent on January 26. [Feb 1st estimate]
Asking Rents Mostly Unchanged Year-over-year
by Calculated Risk on 2/02/2024 11:59:00 AM
Today, in the Real Estate Newsletter: Asking Rents Mostly Unchanged Year-over-year
Brief excerpt:
Here is a graph of the year-over-year (YoY) change for these measures since January 2015. Most of these measures are through December 2023, except CoreLogic is through November and Apartment List is through January 2024.There is much more in the article.
The CoreLogic measure is up 2.7% YoY in November, up from 2.5% in October, and down from a peak of 13.9% in April 2022.
The Zillow measure is up 3.3% YoY in December, mostly unchanged from 3.3% YoY in November, and down from a peak of 16.1% YoY in March 2022.
The ApartmentList measure is down 1.0% YoY as of January, unchanged from -1.10% in December, and down from a peak of 18.2% YoY November 2021.
...
OER and CPI shelter will decline further in the CPI release this month.
Comments on January Employment Report
by Calculated Risk on 2/02/2024 09:28:00 AM
This was a very strong report; however, the benchmark revision showed job growth was slower over the last year than originally reported. Including revisions: The 3.06 million jobs added in 2023 was the 17th best year for job growth in US history (out of 84 years) following the two best years on record (2021 and 2022).
The headline jobs number in the January employment report was well above expectations, and November and December payrolls were revised up by 126,000 combined. The participation rate was unchanged, the employment population ratio increased, and the unemployment rate was unchanged at 3.7%.
Prime (25 to 54 Years Old) Participation
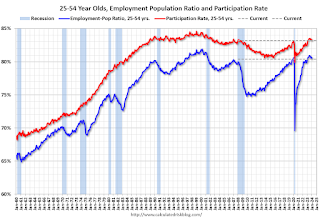 Since the overall participation rate is impacted by both cyclical (recession) and demographic (aging population, younger people staying in school) reasons, here is the employment-population ratio for the key working age group: 25 to 54 years old.
The 25 to 54 years old participation rate increased in January to 83.3% from 83.2% in December, and the 25 to 54 employment population ratio increased to 80.6% from 80.4% the previous month.
Average Hourly Wages
 The graph shows the nominal year-over-year change in "Average Hourly Earnings" for all private employees from the Current Employment Statistics (CES).
 Wage growth has mostly trended down after peaking at 5.9% YoY in March 2022 and was at 4.5% YoY in January.
Part Time for Economic Reasons
 From the BLS report:
"In January, the number of people employed part time for economic reasons, at 4.4 million, changed little. These individuals, who would have preferred full-time employment, were working part time because their hours had been reduced or they were unable to find full-time jobs."The number of persons working part time for economic reasons increased in January to 4.42 million from 4.21 million in December. This is slightly above pre-pandemic levels.
These workers are included in the alternate measure of labor underutilization (U-6) that increased to 7.2% from 7.1% in the previous month. This is down from the record high in April 2020 of 23.0% and up from the lowest level on record (seasonally adjusted) in December 2022 (6.5%). (This series started in 1994). This measure is close to the 7.0% level in February 2020 (pre-pandemic).
Unemployed over 26 Weeks
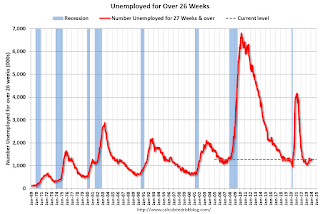 This graph shows the number of workers unemployed for 27 weeks or more.
 According to the BLS, there are 1.277 million workers who have been unemployed for more than 26 weeks and still want a job, up from 1.245 million the previous month.
This is close to pre-pandemic levels.
Job Streak
| Headline Jobs, Top 10 Streaks | ||
|---|---|---|
| Year Ended | Streak, Months | |
| 1 | 2019 | 100 |
| 2 | 1990 | 48 |
| 3 | 2007 | 46 |
| 4 | 1979 | 45 |
| 5 | 20241 | 37 |
| 6 tie | 1943 | 33 |
| 6 tie | 1986 | 33 |
| 6 tie | 2000 | 33 |
| 9 | 1967 | 29 |
| 10 | 1995 | 25 |
| 1Currrent Streak | ||
Summary:
The headline monthly jobs number was well above consensus expectations, and November and December payrolls were revised up by 126,000 combined. The annual benchmark revision indicated job growth was lower than originally reported. The participation rate was unchanged, the employment population ratio increased, and the unemployment rate was unchanged at 3.7%.
January Employment Report: 353 thousand Jobs, 3.7% Unemployment Rate
by Calculated Risk on 2/02/2024 08:30:00 AM
From the BLS:
Total nonfarm payroll employment rose by 353,000 in January, and the unemployment rate remained at 3.7 percent, the U.S. Bureau of Labor Statistics reported today. Job gains occurred in professional and business services, health care, retail trade, and social assistance. Employment declined in the mining, quarrying, and oil and gas extraction industry.
...
The change in total nonfarm payroll employment for November was revised up by 9,000, from +173,000 to +182,000, and the change for December was revised up by 117,000, from +216,000 to +333,000. With these revisions, employment in November and December combined is 126,000 higher than previously reported.
emphasis added
 Click on graph for larger image.
The first graph shows the jobs added per month since January 2021.
Payrolls for November and December were revised up 126 thousand, combined.
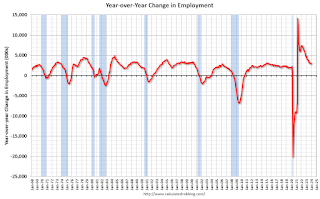 The second graph shows the year-over-year change in total non-farm employment since 1968.
In January, the year-over-year change was 2.93 million jobs. Employment was up solidly year-over-year.
The third graph shows the employment population ratio and the participation rate.
 The Labor Force Participation Rate was unchanged at 62.5% in January, from 62.5% in December. This is the percentage of the working age population in the labor force.
 The Employment-Population ratio increased to 60.2% from 60.41% (blue line).
I'll post the 25 to 54 age group employment-population ratio graph later.
 The fourth graph shows the unemployment rate.
 The unemployment rate was unchanged at 3.7% in January from 3.7% in December.
This was well above consensus expectations and November and December payrolls were revised up by 126,000 combined.
The seasonally adjusted total nonfarm employment level for March 2023 was revised downward by 266,000. On a not seasonally adjusted basis, the total nonfarm employment level for March 2023 was revised downward by 187,000, or -0.1 percent. Not seasonally adjusted, the absolute average benchmark revision over the past 10 years is 0.1 percent.I'll have more later ...


