 RSS Feed
 by Calculated Risk on 2/07/2024 09:10:00 AM
Wednesday, February 07, 2024
Wholesale Used Car Prices "Flat" in December; Down 9.2% Year-over-year
From Manheim Consulting today: Wholesale Used-Vehicle Prices Flat in January
Wholesale used-vehicle prices (on a mix, mileage, and seasonally adjusted basis) were unchanged in January compared to December. The Manheim Used Vehicle Value Index (MUVVI) remained at 204.0 but down 9.2% from a year ago. The index experienced the same 0.0% monthly change from December 2021 to January 2022.
“With the volatility we saw last year, it was a welcome sign for the industry to have a calmer month,” said Jeremy Robb, senior director of Economic and Industry Insights for Cox Automotive. “We observed some price declines in the market in the first couple of weeks of January before the winter storm slowed activity in the wholesale markets during the King holiday week. As activity picked up later in the month, we saw more buying activity, which led to flat values in January. The 0.0% month-over-month change showed stronger values than the 0.2% decline we typically see in January. As we move into tax refund season, we expect to see a bit more activity in the wholesale market, and we maintain that 2024 should show more normal market trends through the year.”
The seasonal adjustment countered the January non-adjusted decrease. The non-adjusted price in January declined by 0.2% compared to December, moving the unadjusted average price down 9.3% year over year.
emphasis added
 Click on graph for larger image.
This index from Manheim Consulting is based on all completed sales transactions at Manheim’s U.S. auctions.
The Manheim index suggests used car prices were unchanged in December (seasonally adjusted) and were down 9.2% year-over-year (YoY).
Trade Deficit at $62.2 Billion in December
by Calculated Risk on 2/07/2024 08:30:00 AM
The Census Bureau and the Bureau of Economic Analysis reported:
The U.S. Census Bureau and the U.S. Bureau of Economic Analysis announced today that the goods and services deficit was $62.2 billion in December, up $0.3 billion from $61.9 billion in November, revised.
December exports were $258.2 billion, $3.9 billion more than November exports. December imports were $320.4 billion, $4.2 billion more than November imports.
emphasis added
 Click on graph for larger image.
Both exports imports increased in December.
Exports are up 3.2% year-over-year; imports are down 0.4$ year-over-year.
Both imports and exports decreased sharply due to COVID-19 and then bounced back - imports and exports are moving sideways recently.
The second graph shows the U.S. trade deficit, with and without petroleum.
 The blue line is the total deficit, and the black line is the petroleum deficit, and the red line is the trade deficit ex-petroleum products.
Note that net, exports of petroleum products are positive and have been increasing.
The trade deficit with China decreased to $22.1 billion from $23.6 billion a year ago.
MBA: Mortgage Applications Increased in Weekly Survey
by Calculated Risk on 2/07/2024 07:00:00 AM
From the MBA: Mortgage Applications Increase in Latest MBA Weekly Survey
Mortgage applications increased 3.7 percent from one week earlier, according to data from the Mortgage Bankers Association’s (MBA) Weekly Mortgage Applications Survey for the week ending February 2, 2024.
The Market Composite Index, a measure of mortgage loan application volume, increased 3.7 percent on a seasonally adjusted basis from one week earlier. On an unadjusted basis, the Index increased 8 percent compared with the previous week. The Refinance Index increased 12 percent from the previous week and was 1 percent higher than the same week one year ago. The seasonally adjusted Purchase Index decreased 1 percent from one week earlier. The unadjusted Purchase Index increased 6 percent compared with the previous week and was 19 percent lower than the same week one year ago.
“Mortgage rates have stayed close to where they started the year, despite swings in Treasury yields because of slowing inflation offset by stronger than expected readings on the job market. The 30-year fixed mortgage rate was 6.8 percent, a slight increase from last week,” said Joel Kan, MBA’s Vice President and Deputy Chief Economist. “Rates at these levels have not prompted much of a reaction in the refinance market, as most homeowners have mortgages with much lower rates. However, purchase activity has been strong to start 2024 compared to the final quarter of 2023. However, activity is still weaker than a year ago because of low housing supply.”
...
The average contract interest rate for 30-year fixed-rate mortgages with conforming loan balances ($766,550 or less) increased to 6.80 percent from 6.78 percent, with points decreasing to 0.59 from 0.65 (including the origination fee) for 80 percent loan-to-value ratio (LTV) loans
emphasis added
 Click on graph for larger image.
The first graph shows the MBA mortgage purchase index.
According to the MBA, purchase activity is down 19% year-over-year unadjusted.
Red is a four-week average (blue is weekly).
Purchase application activity is up from the lows in late October and early November, but still close to the lowest levels during the housing bust.

The second graph shows the refinance index since 1990.
With higher mortgage rates, the refinance index declined sharply in 2022, and even with some recent increases, activity is barely off the bottom.
Tuesday, February 06, 2024
Wednesday: Trade Deficit
by Calculated Risk on 2/06/2024 07:01:00 PM
 Note: Mortgage rates are from MortgageNewsDaily.com and are for top tier scenarios.
Wednesday:
• At 7:00 AM ET, The Mortgage Bankers Association (MBA) will release the results for the mortgage purchase applications index.
• At 8:30 AM, Trade Balance report for December from the Census Bureau. The consensus is the trade deficit to be $62.3 billion. The U.S. trade deficit was at $63.2 billion in November.
NY Fed Q4 Report: Household Debt Increased
by Calculated Risk on 2/06/2024 11:00:00 AM
From the NY Fed: Credit Card and Auto Loan Delinquencies Continue Rising; Notably Among Younger Borrowers
The Federal Reserve Bank of New York’s Center for Microeconomic Data today issued its Quarterly Report on Household Debt and Credit. The report shows total household debt increased by $212 billion (1.2%) in the fourth quarter of 2023, to The report is based on data from the New York Fed’s nationally representative Consumer Credit Panel.
The New York Fed also issued an accompanying Liberty Street Economics blog post examining the composition of auto loan balances and performance by age and income. The Quarterly Report also includes a one-page summary of key takeaways and their supporting data points.
“Credit card and auto loan transitions into delinquency are still rising above pre-pandemic levels,” said Wilbert van der Klaauw, economic research advisor at the New York Fed. “This signals increased financial stress, especially among younger and lower-income households.”
Mortgage balances rose by $112 billion from the previous quarter and stood at $12.25 trillion at the end of December. Balances on home equity lines of credit (HELOC) increased by $11 billion, the seventh consecutive quarterly increase after Q1 2022, and now stand at $360 billion. Credit card balances increased by $50 billion to $1.13 trillion. Auto loan balances rose by $12 billion, continuing the upward trajectory seen since 2020, and now stand at $1.61 trillion.
Mortgage originations continued at a similar pace as seen in the previous two quarters, and now stand at $394 billion. Aggregate limits on credit card accounts increased modestly by $74 billion, representing a 1.6% increase from the previous quarter. Limits on HELOC grew by $24 billion and have grown by 10% over the past two years, after 10 years of observed declines.
Aggregate delinquency rates increased in Q4 2023, with 3.1% of outstanding debt in some stage of delinquency at the end of December. Delinquency transition rates increased for all debt types, except for student loans. Annualized, approximately 8.5% of credit card balances and 7.7% of auto loans transitioned into delinquency. Delinquency transition rates for mortgages increased by 0.2 percentage points yet remain low by historic standards. Serious credit card delinquencies increased across all age groups, notably with younger borrowers surpassing pre-pandemic levels.
emphasis added
 Click on graph for larger image.
Here are three graphs from the report:
The first graph shows household debt increased in Q4. Household debt previously peaked in 2008 and bottomed in Q3 2013. Unlike following the great recession, there wasn't a decline in debt during the pandemic.
From the NY Fed:
Aggregate household debt balances increased by $212 billion in the fourth quarter of 2023, a 1.2% rise from 2023Q3. Balances now stand at $17.50 trillion and have increased by $3.4 trillion since the end of 2019, just before the pandemic recession.
 The second graph shows the percent of debt in delinquency.
The overall delinquency rate increased in Q4. From the NY Fed:
Aggregate delinquency rates increased in the fourth quarter of 2023. As of December, 3.1% of outstanding debt was in some stage of delinquency, up by 0.1 percentage point from the third quarter. Still, overall delinquency rates remain 1.6 percentage points lower than the fourth quarter of 2019.
Delinquency transition rates increased for all product types, except for student loans. Annualized, approximately 8.5% of credit card balances and 7.7% of auto loan balances transitioned into delinquency. Early delinquency transition rates for mortgages increased by 0.2 percentage point yet remain low by historic standards.
About 114,000 consumers had a bankruptcy notation added to their credit reports in 2023Q4, slightly less than in the previous quarter. Approximately 4.7% of consumers have a 3rd party collection account on their credit report
 The third graph shows Mortgage Originations by Credit Score.
From the NY Fed:
Mortgage originations, measured as appearances of new mortgages on consumer credit reports and including both refinance and purchase originations, continued at the same pace observed in the previous two quarters, at $394 billion in 2023Q4, and well below the trillion-dollar-plus quarterly origination volumes observed between 2020Q2 and 2021Q4. ... Limits on home equity lines of credit (HELOC) grew by $24 billion, and have grown by 10% over the past two years after ten years of decreasesThere is much more in the report.
ICE (Black Knight) Mortgage Monitor: "Positive Signs in Housing, Mortgage Markets"
by Calculated Risk on 2/06/2024 08:58:00 AM
Today, in the Real Estate Newsletter: ICE (Black Knight) Mortgage Monitor: "Positive Signs in Housing, Mortgage Markets"
Brief excerpt:
There have been very few low credit score mortgage originations. During the housing bubble, many of the low credit score loans were made through the private-labeled securities market.There is much more in the article.
• In the absence of any meaningful private-labeled securities market, the rise in FHA delinquencies is worth watching, as FHA and VA loans can be early indicators of broader mortgage performance trends
• While low credit score lending hit a record low, by count, in 2023, 90% below the years leading up to the great financial crisis, FHA and VA products have accounted for roughly 70% of sub-660 credit score lending for most of the past decade
• This is a stark contrast from the 2004-2006 era when FHA and VA lending played a minimal role (<10%) in lower credit score lending, which then was dominated by loans backed by private-labeled securities and held in portfolio
• Given the low volume of sub-660 credit score lending and that overall delinquencies remain historically low, FHA and VA delinquencies are not currently a cause for significant broad based market concern, but are worth keeping a close eye on for those invested in GNMA securities as well as non-banks that participate more heavily in FHA and VA lending

CoreLogic: US Home Prices Increased 5.5% Year-over-year in December
by Calculated Risk on 2/06/2024 08:21:00 AM
Notes: This CoreLogic House Price Index report is for December. The recent Case-Shiller index release was for November. The CoreLogic HPI is a three-month weighted average and is not seasonally adjusted (NSA).
From CoreLogic: Job Growth Continues to Drive Annual Home Price Gains in December, CoreLogic Reports
• Annual U.S. home price growth was 5.5% in December 2023, the highest rate of appreciation recorded since January 2023.
• Year-over-year U.S. home prices have recorded annual gains since early 2012.
• In 2023, the average CoreLogic Home Price Index gain was 3.9%, down from 14.5% in 2022 but the same as the annual average in 2019.
• Northeastern states continued to lead the U.S. for annual price gains, with Rhode Island on top at 13.3%.
• Among large metro areas, Miami returned to the No 1. spot for year-over-year home price increases in December, posting a gain of almost 11%.
...
“Last winter’s mortgage rate surge impacted seasonal home price changes in many markets and suggests that annual gains may have reached the cycle peak and will level off in the coming months,” said Dr. Selma Hepp, chief economist for CoreLogic. “But while appreciation is projected to slow, home prices will continue to extend to new highs entering the typically busy spring homebuying season. Also, while the recent dip in mortgage rates help improve some affordability challenges, additional rate declines may not arrive until the second half of 2024.”
“The 2024 homebuying season should enjoy a boost because of pent-up demand, as well as a robust job market and wage growth,” Hepp continued. “Geographic patterns in price gains continued to favor housing markets in the Northeast and the South, especially those that remain more affordable and have lagged in home price increases over the past couple of years.”
emphasis added
Monday, February 05, 2024
Tuesday: Q4 Quarterly Report on Household Debt and Credit
by Calculated Risk on 2/05/2024 07:01:00 PM
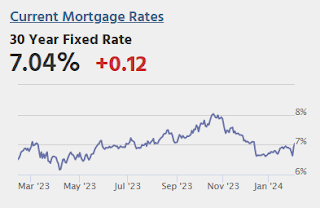 From Matthew Graham at Mortgage News Daily: Mortgage Rates Launched Back Over 7% by Strong Economic Data
Last Friday was the worst day for mortgage rates in over a year in terms of day-over-day movement (October 19th, 2023 remains the worst day in decades in terms of outright levels with 30yr fixed rates over 8%).Tuesday:
Monday added insult to injury with another sharp increase that took the average top tier conventional 30yr fixed rate back over 7% for the first time since December 12th.
In both cases, the most relevant catalyst was an upbeat economic report. We already know that it was the big jobs report that did the damage on Friday. Today's rate rout came courtesy of the ISM Non-Manufacturing PMI (aka ISM Services). [30 year fixed 6.88%]
emphasis added
• At 8:00 AM ET: Corelogic House Price index for December.
• At 11:00 AM, NY Fed: Q4 Quarterly Report on Household Debt and Credit
Fed SLOOS Survey: Banks reported Tighter Standards, Weaker Demand for almost All Loan Types
by Calculated Risk on 2/05/2024 02:00:00 PM
From the Federal Reserve: he January 2024 Senior Loan Officer Opinion Survey on Bank Lending Practices
The January 2024 Senior Loan Officer Opinion Survey on Bank Lending Practices (SLOOS) addressed changes in the standards and terms on, and demand for, bank loans to businesses and households over the past three months, which generally correspond to the fourth quarter of 2023.
Regarding loans to businesses, survey respondents, on balance, reported tighter standards and weaker demand for commercial and industrial (C&I) loans to firms of all sizes over the fourth quarter. Furthermore, banks reported tighter standards and weaker demand for all commercial real estate (CRE) loan categories.
For loans to households, banks, on balance, reported that lending standards tightened across all categories of residential real estate (RRE) loans other than government residential mortgages and government-sponsored enterprise (GSE)-eligible residential mortgages, for which standards remained basically unchanged. Meanwhile, demand weakened for all RRE loan categories. In addition, banks reported tighter standards and weaker demand for home equity lines of credit (HELOCs). Moreover, for credit card, auto, and other consumer loans, standards reportedly tightened, and demand weakened on balance.
While banks, on balance, reported having tightened lending standards further for most loan categories in the fourth quarter, lower net shares of banks reported tightening lending standards than in the third quarter across all loan categories.
The January SLOOS also included a set of special questions inquiring about banks’ expectations for changes in lending standards, borrower demand, and loan performance over 2024. Banks, on balance, reported expecting lending standards to remain basically unchanged for C&I and RRE loans, but to tighten further for CRE, credit card, and auto loans. In addition, banks reported expecting loan demand to strengthen across all loan categories, and loan quality to deteriorate across most loan types.
emphasis added
 Click on graph for larger image.
This graph on Residential Real Estate demand is from the Senior Loan Officer Survey Charts.
The upper graphs are for standards and shows standards have tightened.
The lower graph is for demand and shows that demand has declined.
The left graphs are from 1990 to 2014. The right graphs are from 2015 to Q4 2023.
Lawler: Update on Mortgage Rates and Spreads
by Calculated Risk on 2/05/2024 10:08:00 AM
Today, in the Real Estate Newsletter: Lawler: Update on Mortgage Rates and Spreads
Brief excerpt:
From housing economist Tom Lawler:There is much more in the article.
For the second consecutive year 2023 saw high levels of volatility in the US fixed-income markets in general and the mortgage/MBS markets in particular. Unlike in 2022, however, key Treasury rates and mortgage/MBS yields ended 2023 close to where they began.
30-Yr CCMBS: Yield on “notional par” MBS derived from price for coupon closest to but below par and price for coupon closest to but above par.
30-Yr FRM: Optimal Blue 30-year index for borrowers with LTV<=80 and FICO>740.
...
Much of the “angst” in the MBS market over the last year and a half (aside from high interest rate volatility) was associated with “extension risk” – that is, the slowdown in MBS prepayments when interest rates increase. The sharp increase in mortgage rates following the uber-low rates of the previous few years resulted in a huge number of mortgages with rates well over 300 basis points below current market rates. That had not been seen in over 40 years, and most prepayment models had little or no data on how slow mortgage prepayments could get. In turned out that the answer was “really low” and lower than many models projected, meaning that MBS backed by these low-rate mortgages saw their duration extend by much more than many MBS investors had expected, leading to much larger than “expected” mark-to-market losses.


