 RSS Feed
 by Calculated Risk on 2/12/2024 08:12:00 AM
Monday, February 12, 2024
Housing February 12th Weekly Update: Inventory Down 0.5% Week-over-week, Up 11.4% Year-over-year
Altos reports that active single-family inventory was down 0.5% week-over-week. I expect inventory to bottom in February this year, as opposed to mid-April in 2023.
 Click on graph for larger image.
This inventory graph is courtesy of Altos Research.
As of February 9th, inventory was at 495 thousand (7-day average), compared to 497 thousand the prior week.
Inventory is still far below pre-pandemic levels.

The red line is for 2024. The black line is for 2019. Note that inventory is up 99% from the record low for the same week in 2022, but still well below normal levels.
Inventory was up 11.4% compared to the same week in 2023 (last week it was up 8.7%), and down 39.1% compared to the same week in 2019 (last week also down 39.1%).
Back in June 2023, inventory was down almost 54% compared to 2019, so the gap to more normal inventory levels has closed a little.
Mike Simonsen discusses this data regularly on Youtube.
Sunday, February 11, 2024
Sunday Night Futures
by Calculated Risk on 2/11/2024 11:23:00 PM
Weekend:
• Schedule for Week of February 11, 2024
Monday:
• No major economic releases scheduled.
From CNBC: Pre-Market Data and Bloomberg futures S&P 500 and DOW futures are mostly unchanged (fair value).
Oil prices were up over the last week with WTI futures at $76.84 per barrel and Brent at $82.19 per barrel. A year ago, WTI was at $80, and Brent was at $85 - so WTI oil prices were down slightly year-over-year.
Here is a graph from Gasbuddy.com for nationwide gasoline prices. Nationally prices are at $3.18 per gallon. A year ago, prices were at $3.39 per gallon, so gasoline prices are down $0.21 year-over-year.
By Request: Public and Private Sector Payroll Jobs During Presidential Terms
by Calculated Risk on 2/11/2024 10:13:00 AM
Note: I used to post this monthly, but I stopped during the COVID-19 pandemic. I've received a number of requests lately to post this again, so here is another update of tracking employment during Presidential terms. We frequently use Presidential terms as time markers - we could use Speaker of the House, Fed Chair, or any other marker.
Important: There are many differences between these periods. Overall employment was smaller in the '80s, however the participation rate was increasing in the '80s (younger population and women joining the labor force), and the participation rate is generally declining now. But these graphs give an overview of employment changes.
The first graph shows the change in private sector payroll jobs from when each president took office until the end of their term(s). Presidents Carter, George H.W. Bush and Trump only served one term.
Mr. G.W. Bush (red) took office following the bursting of the stock market bubble and left during the bursting of the housing bubble. Mr. Obama (dark blue) took office during the financial crisis and great recession. There was also a significant recession in the early '80s right after Mr. Reagan (dark red) took office.
There was a recession towards the end of President G.H.W. Bush (light purple) term, and Mr. Clinton (light blue) served for eight years without a recession. And there was a pandemic related recession in 2020.
First, here is a table for private sector jobs. The top two previous private sector terms were both under President Clinton.
| Term | Private Sector Jobs Added (000s) |
|---|---|
| Biden | 13,4811 |
| Clinton 1 | 10,876 |
| Clinton 2 | 10,094 |
| Obama 2 | 9,926 |
| Reagan 2 | 9,351 |
| Carter | 9,039 |
| Reagan 1 | 5,363 |
| Obama 1 | 1,907 |
| GHW Bush | 1,507 |
| GW Bush 2 | 443 |
| GW Bush 1 | -820 |
| Trump | -2,192 |
| 1After 36 months. | |
 Click on graph for larger image.
The first graph is for private employment only.
Private sector employment increased by 9,039,000 under President Carter (dashed green), by 14,714,000 under President Reagan (dark red), 1,507,000 under President G.H.W. Bush (light purple), 20,970,000 under President Clinton (light blue), lost 377,000 under President G.W. Bush, and gained 11,833,000 under President Obama (dark dashed blue). During Trump's term (Orange), the economy lost 2,135,000 private sector jobs.
In the first 36 months of President Biden's term (Blue), the economy has added 13,481,000 private sector jobs, as the economy recovered from the pandemic.
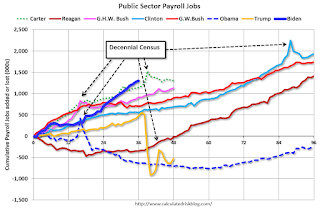 A big difference between the presidencies has been public sector employment. Note: the bumps in public sector employment due to the decennial Census in 1980, 1990, 2000, 2010 and 2020.
The public sector grew during Mr. Carter's term (up 1,304,000), during Mr. Reagan's terms (up 1,414,000), during Mr. G.H.W. Bush's term (up 1,127,000), during Mr. Clinton's terms (up 1,934,000), and during Mr. G.W. Bush's terms (up 1,744,000 jobs). However, the public sector declined significantly while Mr. Obama was in office (down 263,000 jobs). During Trump's term, the economy lost 528,000 public sector jobs.
 A big difference between the presidencies has been public sector employment. Note: the bumps in public sector employment due to the decennial Census in 1980, 1990, 2000, 2010 and 2020.
 The public sector grew during Mr. Carter's term (up 1,304,000), during Mr. Reagan's terms (up 1,414,000), during Mr. G.H.W. Bush's term (up 1,127,000), during Mr. Clinton's terms (up 1,934,000), and during Mr. G.W. Bush's terms (up 1,744,000 jobs). However, the public sector declined significantly while Mr. Obama was in office (down 263,000 jobs). During Trump's term, the economy lost 528,000 public sector jobs.
In the first 36 months of President Biden's term, the economy has added 1,303,000 public sector jobs (about 93% of public job growth has been for state and local governments, and about 58% for education).
| Term | Public Sector Jobs Added (000s) |
|---|---|
| Reagan 2 | 1,438 |
| Carter | 1,304 |
| Biden | 1,3031 |
| Clinton 2 | 1,242 |
| GHW Bush | 1,127 |
| GW Bush 1 | 900 |
| GW Bush 2 | 844 |
| Clinton 1 | 692 |
| Obama 2 | 447 |
| Reagan 1 | -24 |
| Trump | -528 |
| Obama 1 | -710 |
| 1After 36 months. | |
Saturday, February 10, 2024
Real Estate Newsletter Articles this Week: Update on Mortgage Rates and Spreads
by Calculated Risk on 2/10/2024 02:11:00 PM
At the Calculated Risk Real Estate Newsletter this week:
• Lawler: Update on Mortgage Rates and Spreads
• MBA: Mortgage Delinquencies Increase in Q4 2023
• 1st Look at Local Housing Markets in January
• ICE (Black Knight) Mortgage Monitor: "Positive Signs in Housing, Mortgage Markets"
This is usually published 4 to 6 times a week and provides more in-depth analysis of the housing market.
Schedule for Week of February 11, 2024
by Calculated Risk on 2/10/2024 08:11:00 AM
The key reports this week are January CPI, Housing Starts, and Retail sales.
For manufacturing, the January Industrial Production report, and the February NY and Philly Fed manufacturing surveys will be released this week.
No major economic releases scheduled.
6:00 AM: NFIB Small Business Optimism Index for January.
8:30 AM: The Consumer Price Index for January from the BLS. The consensus is for 0.2% increase in CPI, and a 0.3% increase in core CPI. The consensus is for CPI to be up 3.0% year-over-year and core CPI to be up 3.8% YoY.
7:00 AM ET: The Mortgage Bankers Association (MBA) will release the results for the mortgage purchase applications index.
8:30 AM: The initial weekly unemployment claims report will be released. The consensus is for 212 thousand initial claims, down from 218 thousand last week.
 8:30 AM: Retail sales for January is scheduled to be released. The consensus is for a 0.1% decrease in retail sales.
This graph shows retail sales since 1992. This is monthly retail sales and food service, seasonally adjusted (total and ex-gasoline).
8:30 AM: The New York Fed Empire State manufacturing survey for February. The consensus is for a reading of -12.5, up from -43.7.
8:30 AM: The Philly Fed manufacturing survey for February. The consensus is for a reading of -8.0, up from -10.6.
 9:15 AM: The Fed will release Industrial Production and Capacity Utilization for January.
This graph shows industrial production since 1967.
The consensus is for a 0.3% increase in Industrial Production, and for Capacity Utilization to increase to 79.0%.
10:00 AM: The February NAHB homebuilder survey. The consensus is for a reading of 46, up from 44. Any number below 50 indicates that more builders view sales conditions as poor than good.
 8:30 AM: Housing Starts for January.
 This graph shows single and multi-family housing starts since 1968.
The consensus is for 1.470 million SAAR, up from 1.460 million SAAR.
8:30 AM ET: The Producer Price Index for January from the BLS. The consensus is for a 0.1% increase in PPI, and a 0.1% increase in core PPI.
10:00 AM: University of Michigan's Consumer sentiment index (Preliminary for February). The consensus is for a reading of 79.0.
Friday, February 09, 2024
Feb 9th COVID Update: Weekly Deaths Increased
by Calculated Risk on 2/09/2024 07:16:00 PM
 Note: Mortgage rates are from MortgageNewsDaily.com and are for top tier scenarios.
Due to changes at the CDC, weekly cases are no longer updated.
For deaths, I'm currently using 4 weeks ago for "now", since the most recent three weeks will be revised significantly.
Hospitalizations have almost quadrupled from a low of 5,150 in June 2023, however, they have declined from around 30,000 in early 2024.
| COVID Metrics | ||||
|---|---|---|---|---|
| Now | Week Ago | Goal | ||
| Hospitalized2 | 19,458 | 22,057 | ≤3,0001 | |
| Deaths per Week2🚩 | 2,318 | 2,278 | ≤3501 | |
| 1my goals to stop weekly posts, 2Weekly for Currently Hospitalized, and Deaths 🚩 Increasing number weekly for Hospitalized and Deaths ✅ Goal met. | ||||
 Click on graph for larger image.
This graph shows the weekly (columns) number of deaths reported.
Weekly deaths have more than quadrupled from a low of 485 in early July. Still weekly deaths are far below the weekly peak of 26,000 in January 2021. Weekly deaths will likely decline soon.
AAR: January Carloads Down and Intermodal Up YoY
by Calculated Risk on 2/09/2024 03:10:00 PM
From the Association of American Railroads (AAR) Rail Time Indicators. Graphs and excerpts reprinted with permission.
In January, severe winter weather significantly disrupted railroad and rail customer operations in much of the country. Moreover, uncertainty remains in the economy, especially in sectors that are important to railroads, like manufacturing. Because of these factors, January is not necessarily a harbinger of what’s to come for rail traffic in the months ahead. That’s important to note, because total carloads on U.S. railroads fell 7.2%, or 79,725 carloads, in January 2024 from January 2023. It’s the largest year-over-year percentage decline for total carloads since February 2021 (another month when rail volumes were impacted by severe winter weather).
Intermodal (which is not included in carloads) fared better in January: intermodal originations were up 5.5% over last year, their fifth consecutive gain following 18 consecutive declines. Gains in intermodal are partly due to higher port volumes over the past six months
emphasis added
 Click on graph for larger image.
This graph from the Rail Time Indicators report shows the six-week average of U.S. Carloads in 2022, 2023 and 2024:
n January, U.S. railroads (excluding the U.S. operations of Canadian and Mexican railroads) originated 1.03 million total carloads, down 7.2% (79,725 carloads) from January 2023. Total carloads averaged 205,034 per week in January 2024, the smallest weekly average for January in our records that go back to 1988. (Since 1988, six months overall had lower weekly average carloads, most recently December 2022.)
 The second graph shows the six-week average (not monthly) of U.S. intermodal in 2022, 2023 and 2024: (using intermodal or shipping containers):
Intermodal fared better than carloads in January: intermodal originations totaled 1.21 million containers and trailers, up 5.5% (63,195 units) over January 2023. That’s intermodal’s fifth consecutive year-over-year monthly gain following 18 consecutive declines.
Poor Weather Reduced Employment by About 50,000 in January
by Calculated Risk on 2/09/2024 01:20:00 PM
The BLS reported 353 thousand non-farm jobs were added in January. During the Winter months, I like to look at the weather impact on the report.
The BLS reported 553 thousand people were employed in non-agriculture industries, with a job, but not at work due to bad weather. The average for January over the previous 10 years was 257 thousand (median 248 thousand), so more people than normal were impacted by bad weather.
The BLS also reported 1.794 million people that are usually full-time employees were working part time in January due to bad weather. The average for January over the previous 10 years was 835 thousand (the median was 645 thousand). This series suggests weather negatively impacted employment more than usual.
The San Francisco Fed estimates Weather-Adjusted Change in Total Nonfarm Employment (monthly change, seasonally adjusted). They use local area weather to estimate the impact on employment. For January, the San Francisco Fed estimated that weather reduced employment by 40 to 60 thousand jobs.
It appears weather adjusted job gains were around 400 thousand in January (seasonally adjusted)
Early GDP Tracking: Solid Start for Q1
by Calculated Risk on 2/09/2024 11:30:00 AM
From BofA:
Next week, we will start 1Q GDP tracking with the January advance retail sales print. [Feb 9th comment]From Goldman:
emphasis added
We boosted our Q1 GDP tracking estimate by 0.1pp to +2.9% (qoq ar) and we left our domestic final sales forecast unchanged at +3.2% (qoq ar). [Feb 7th estimate]And from the Altanta Fed: GDPNow
The GDPNow model estimate for real GDP growth (seasonally adjusted annual rate) in the first quarter of 2024 is 3.4 percent on February 8, unchanged from February 7 after rounding. [Feb 8th estimate]
Updated Seasonal Factors for CPI
by Calculated Risk on 2/09/2024 08:30:00 AM
The BLS updated the seasonal factors for CPI.
Although the changes were small, CPI over the last 6 months increased 3.1% (annualized) compared to the previously announced 3.3%.
CPI for December was revised down from a 0.30% month-over-month increase to 0.23% with the updated seasonal factors.
Core CPI was essentially unchanged over the last 6 months.
Core CPI was essentially unchanged over the last 6 months.


