by Calculated Risk on 2/15/2024 08:30:00 AM
Thursday, February 15, 2024
Weekly Initial Unemployment Claims Decrease to 212,000
The DOL reported:
In the week ending February 10, the advance figure for seasonally adjusted initial claims was 212,000, a decrease of 8,000 from the previous week's revised level. The previous week's level was revised up by 2,000 from 218,000 to 220,000. The 4-week moving average was 218,500, an increase of 5,750 from the previous week's revised average. The previous week's average was revised up by 500 from 212,250 to 212,750.The following graph shows the 4-week moving average of weekly claims since 1971.
emphasis added
 Click on graph for larger image.
The dashed line on the graph is the current 4-week average. The four-week average of weekly unemployment claims increased to 218,500.
The previous week was revised up.
Weekly claims were at the consensus forecast.
Wednesday, February 14, 2024
Thursday: Retail Sales, Unemployment Claims, NY & Philly Fed Mfg, Industrial Production, Homebuilder Survey
by Calculated Risk on 2/14/2024 07:11:00 PM

Thursday:
• At 8:30 AM ET, The initial weekly unemployment claims report will be released. The consensus is for 212 thousand initial claims, down from 218 thousand last week.
• Also at 8:30 AM, Retail sales for January is scheduled to be released. The consensus is for a 0.1% decrease in retail sales.
• Also at 8:30 AM, The New York Fed Empire State manufacturing survey for February. The consensus is for a reading of -12.5, up from -43.7.
• Also at 8:30 AM, The Philly Fed manufacturing survey for February. The consensus is for a reading of -8.0, up from -10.6.
• At 9:15 AM, The Fed will release Industrial Production and Capacity Utilization for January. The consensus is for a 0.3% increase in Industrial Production, and for Capacity Utilization to increase to 79.0%.
• At 10:00 AM,The February NAHB homebuilder survey. The consensus is for a reading of 46, up from 44. Any number below 50 indicates that more builders view sales conditions as poor than good.
LA Port Inbound Traffic Increased Year-over-year in January
by Calculated Risk on 2/14/2024 03:13:00 PM
Container traffic gives us an idea about the volume of goods being exported and imported - and usually some hints about the trade report since LA area ports handle about 40% of the nation's container port traffic.
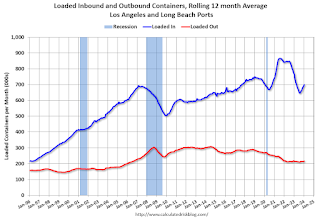
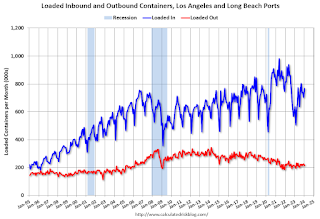
The following graphs are for inbound and outbound traffic at the ports of Los Angeles and Long Beach in TEUs (TEUs: 20-foot equivalent units or 20-foot-long cargo container).
To remove the strong seasonal component for inbound traffic, the first graph shows the rolling 12-month average.

On a rolling 12-month basis, inbound traffic increased 1.6% in January compared to the rolling 12 months ending in December. Outbound traffic increased 0.2% compared to the rolling 12 months ending the previous month.
 Usually imports peak in the July to October period as retailers import goods for the Christmas holiday, and then decline sharply and bottom in the Winter depending on the timing of the Chinese New Year.
 Part 2: Current State of the Housing Market; Overview for mid-February 2024
by Calculated Risk on 2/14/2024 10:48:00 AM
Today, in the Calculated Risk Real Estate Newsletter: Part 2: Current State of the Housing Market; Overview for mid-February 2024
A brief excerpt:
“If you do not know where you come from, then you don't know where you are, and if you don't know where you are, then you don't know where you're going. And if you don't know where you're going, you're probably going wrong.” Terry PratchettThere is much more in the article.
These “Current State” summaries show us where we came from, where we are, and hopefully give us clues as to where we are going!
Yesterday, in Part 1: Current State of the Housing Market; Overview for mid-February 2024 I reviewed home inventory, housing starts and sales.
...
Other measures of house prices suggest prices will be up further YoY in the December Case-Shiller index. The NAR reported median prices were up 4.4% YoY in December, up from 4.0% YoY in November. ICE (formerly Black Knight) reported prices were up 5.6% YoY in December, up from 5.1% YoY in November to new all-time highs, and Freddie Mac reported house prices were up 6.6% YoY in December, up from 6.1% YoY in November - and also to new all-time highs.
Here is a comparison of year-over-year change in the FMHPI, median house prices from the NAR, and the Case-Shiller National index.
The FMHPI and the NAR median prices appear to be leading indicators for Case-Shiller. Based on recent monthly data, and the FMHPI, the YoY change in the Case-Shiller index will increase further in the report for December.
MBA: Mortgage Applications Decreased in Weekly Survey
by Calculated Risk on 2/14/2024 07:00:00 AM
From the MBA: Mortgage Applications Decrease in Latest MBA Weekly Survey
Mortgage applications decreased 2.3 percent from one week earlier, according to data from the Mortgage Bankers Association’s (MBA) Weekly Mortgage Applications Survey for the week ending February 9, 2024.
The Market Composite Index, a measure of mortgage loan application volume, decreased 2.3 percent on a seasonally adjusted basis from one week earlier. On an unadjusted basis, the Index increased 2 percent compared with the previous week. The Refinance Index decreased 2 percent from the previous week and was 12 percent higher than the same week one year ago. The seasonally adjusted Purchase Index decreased 3 percent from one week earlier. The unadjusted Purchase Index increased 4 percent compared with the previous week and was 12 percent lower than the same week one year ago.
“Application activity was weaker last week, as mortgage rates moved higher across the board. The 30- year fixed mortgage rate was up to 6.87 percent – the highest rate since early December 2023,” said Joel Kan, MBA’s Vice President and Deputy Chief Economist. “Purchase applications remained subdued as elevated rates continue to add to affordability challenges along with still-low existing housing inventory. Refinance applications declined and remained depressed, with rates still higher than a year ago.”
...
The average contract interest rate for 30-year fixed-rate mortgages with conforming loan balances ($766,550 or less) increased to 6.87 percent from 6.80 percent, with points increasing to 0.65 from 0.59 (including the origination fee) for 80 percent loan-to-value ratio (LTV) loans.
emphasis added
 Click on graph for larger image.
The first graph shows the MBA mortgage purchase index.
According to the MBA, purchase activity is down 12% year-over-year unadjusted.

Tuesday, February 13, 2024
Wednesday: Mortgage Applications
by Calculated Risk on 2/13/2024 07:19:00 PM

Wednesday:
• At 7:00 AM ET, The Mortgage Bankers Association (MBA) will release the results for the mortgage purchase applications index.
Cleveland Fed: Median CPI increased 0.5% and Trimmed-mean CPI increased 0.5% in January
by Calculated Risk on 2/13/2024 02:33:00 PM
According to the Federal Reserve Bank of Cleveland, the median Consumer Price Index rose 0.5% in January. The 16% trimmed-mean Consumer Price Index increased 0.5%. "The median CPI and 16% trimmed-mean CPI are measures of core inflation calculated by the Federal Reserve Bank of Cleveland based on data released in the Bureau of Labor Statistics’ (BLS) monthly CPI report".
 Click on graph for larger image.
This graph shows the year-over-year change for these four key measures of inflation.
Note: The Cleveland Fed released the median CPI details. "Used cars and trucks" and "motor fuel" decreased at a 33% annual rate in January.
2nd Look at Local Housing Markets in January
by Calculated Risk on 2/13/2024 11:22:00 AM
Today, in the Calculated Risk Real Estate Newsletter: 2nd Look at Local Housing Markets in January
A brief excerpt:
NOTE: The tables for active listings, new listings and closed sales all include a comparison to January 2019 for each local market (some 2019 data is not available).There is much more in the article.
This is the second look at several local markets in January. I’m tracking about 40 local housing markets in the US. Some of the 40 markets are states, and some are metropolitan areas. I’ll update these tables throughout the month as additional data is released.
Closed sales in January were mostly for contracts signed in November and December when 30-year mortgage rates averaged 7.44% and 6.82%, respectively.
...
Here is a summary of active listings for these housing markets in January.
Inventory for these markets were up 5.5% year-over-year in December and are now up 10.9% year-over-year. A key will be if inventory builds over the next few months.
Special Note: Florida is overweighted in this early sample, and that has distorted the overall picture (since inventory is surging in Florida).
Inventory is down sharply in all of these areas compared to 2019.
...
Many more local markets to come!
YoY Measures of Inflation: Services, Goods and Shelter
by Calculated Risk on 2/13/2024 09:00:00 AM
Here are a few measures of inflation:
The first graph is the one Fed Chair Powell had mentioned when services less rent of shelter was up around 8% year-over-year. This declined and is now up 3.6% YoY.

This graph shows the YoY price change for Services and Services less rent of shelter through January 2024.
Services less rent of shelter was up 3.6% YoY in January, up from 3.4% YoY in December.
 The second graph shows that goods prices started to increase year-over-year (YoY) in 2020 and accelerated in 2021 due to both strong demand and supply chain disruptions.
Commodities less food and energy commodities were down 0.3% YoY in January, down from up 0.1% YoY in December.
 Here is a graph of the year-over-year change in shelter from the CPI report (through January) and housing from the PCE report (through December 2023)
Shelter was up 6.1% year-over-year in January, down from 6.2% in December. Housing (PCE) was up 6.4% YoY in December, down from 6.7% in November.
Core CPI ex-shelter was up 2.2% YoY in January, unchanged from 2.2% in December.
BLS: CPI Increased 0.3% in January; Core CPI increased 0.4%
by Calculated Risk on 2/13/2024 08:30:00 AM
The Consumer Price Index for All Urban Consumers (CPI-U) increased 0.3 percent in January on a seasonally adjusted basis, after rising 0.2 percent in December, the U.S. Bureau of Labor Statistics reported today. Over the last 12 months, the all items index increased 3.1 percent before seasonal adjustment.The change in both CPI and core CPI were above expectations. I'll post a graph later today after the Cleveland Fed releases the median and trimmed-mean CPI.
The index for shelter continued to rise in January, increasing 0.6 percent and contributing over two thirds of the monthly all items increase. The food index increased 0.4 percent in January, as the food at home index increased 0.4 percent and the food away from home index rose 0.5 percent over the month. In contrast, the energy index fell 0.9 percent over the month due in large part to the decline in the gasoline index.
The index for all items less food and energy rose 0.4 percent in January. Indexes which increased in January include shelter, motor vehicle insurance, and medical care. The index for used cars and trucks and the index for apparel were among those that decreased over the month.
The all items index rose 3.1 percent for the 12 months ending January, a smaller increase than the 3.4-percent increase for the 12 months ending December. The all items less food and energy index rose 3.9 percent over the last 12 months, the same increase as for the 12 months ending December. The energy index decreased 4.6 percent for the 12 months ending January, while the food index increased 2.6 percent over the last year.
emphasis added


