 RSS Feed
 by Calculated Risk on 2/15/2024 01:31:00 PM
Thursday, February 15, 2024
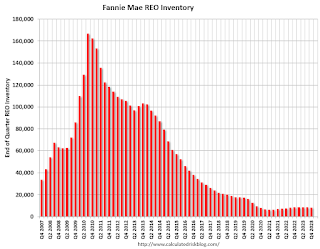
Fannie "Real Estate Owned" inventory Decreased in Q4 2023
Fannie reported results for Q4 2023. Here is some information on single-family Real Estate Owned (REOs).
Fannie Mae reported the number of REOs decreased to 8,403 at the end of Q4 2023, down 4% from 8,779 at the end of Q4 2022.
For Fannie, this is down 95% from the 166,787 peak number of REOs in Q3 2010.
 Click on graph for larger image.
Here is a graph of Fannie Real Estate Owned (REO).
This is well below the normal level of REOs for Fannie, and although REO levels might increase in 2024, there will not be a huge wave of foreclosures.
 Click on graph for larger image.
Here is a graph of Fannie Real Estate Owned (REO).
This is well below the normal level of REOs for Fannie, and although REO levels might increase in 2024, there will not be a huge wave of foreclosures.
NAHB: Builder Confidence Increased in February
by Calculated Risk on 2/15/2024 10:00:00 AM
The National Association of Home Builders (NAHB) reported the housing market index (HMI) was at 48, up from 44 last month. Any number below 50 indicates that more builders view sales conditions as poor than good.
From the NAHB: Builder Sentiment Posts Third Consecutive Monthly Gain
Expectations that mortgage rates will continue to moderate in the coming months, the prospect of future rate cuts by the Federal Reserve later this year, and a protracted lack of existing inventory helped provide a boost to builder sentiment for the third straight month.
Builder confidence in the market for newly built single-family homes climbed four points to 48 in February, according to the National Association of Home Builders (NAHB)/Wells Fargo Housing Market Index (HMI) released today. This is the highest level since August 2023.
“Buyer traffic is improving as even small declines in interest rates will produce a disproportionate positive response among likely home purchasers,” said NAHB Chairman Alicia Huey, a custom home builder and developer from Birmingham, Ala. “And while mortgage rates still remain too high for many prospective buyers, we anticipate that due to pent-up demand, many more buyers will enter the marketplace if mortgage rates continue to decline this year.”
“With future expectations of Fed rate cuts in the latter half of 2024, NAHB is forecasting that single-family starts will rise about 5% this year,” said NAHB Chief Economist Robert Dietz. “But as builders break ground on more homes, lot availability is expected to be a growing concern, along with persistent labor shortages. And as a further reminder that the recovery will be bumpy as buyers remain sensitive to interest rate and construction cost changes, the 10-year Treasury rate is up more than 40 basis points since the beginning of the year.”
With mortgage rates now below 7% since mid-December, more builders are cutting back on reducing home prices to boost sales. In February, 25% of builders reported cutting home prices, down from 31% in January and 36% in the last two months of 2023. However, the average price reduction in February held steady at 6% for the eighth straight month. Meanwhile, the use of sales incentives is also diminishing. The share of builders offering some form of incentive dropped to 58% in February, down from 62% in January and the lowest share since last August.
...
All three of the major HMI indices posted gains in February. The HMI index charting current sales conditions increased four points to 52, the component measuring sales expectations in the next six months rose three points to 60 and the component gauging traffic of prospective buyers increased four points to 33.
Looking at the three-month moving averages for regional HMI scores, the Northeast increased three points to 57, the Midwest gained two points to 36, the South rose five points to 46 and the West registered a six-point gain to 38.
emphasis added
 Click on graph for larger image.
This graph shows the NAHB index since Jan 1985.
This was above the consensus forecast.
Industrial Production Decreased 0.1% in January
by Calculated Risk on 2/15/2024 09:15:00 AM
From the Fed: Industrial Production and Capacity Utilization
Industrial production edged down 0.1 percent in January after recording no change in December. In January, manufacturing output declined 0.5 percent and mining output fell 2.3 percent; winter weather contributed to the declines in both sectors. The index for utilities jumped 6.0 percent, as demand for heating surged following a move from unusually mild temperatures in December to unusually cold temperatures in January. At 102.6 percent of its 2017 average, total industrial production in January was identical to its year-earlier level. Capacity utilization for the industrial sector moved down 0.2 percentage point in January to 78.5 percent, a rate that is 1.1 percentage points below its long-run (1972–2023) average.
emphasis added
 Click on graph for larger image.
This graph shows Capacity Utilization. This series is up from the record low set in April 2020, and above the level in February 2020 (pre-pandemic).
Capacity utilization at 78.5% is 1.1% below the average from 1972 to 2022. This was below consensus expectations.
Note: y-axis doesn't start at zero to better show the change.
 The second graph shows industrial production since 1967.
Industrial production decreased to 102.6. This is above the pre-pandemic level.
Industrial production was below consensus expectations.
Retail Sales Decreased 0.8% in January
by Calculated Risk on 2/15/2024 08:35:00 AM
On a monthly basis, retail sales were down 0.8% from December to January (seasonally adjusted), and sales were up 0.6 percent from January 2023.
From the Census Bureau report:
Advance estimates of U.S. retail and food services sales for January 2024, adjusted for seasonal variation and holiday and trading-day differences, but not for price changes, were $700.3 billion, down 0.8 percent from the previous month, and up 0.6 percent above January 2023. ... The November 2023 to December 2023 percent change was revised from up 0.6 percent to up 0.4 percent.
emphasis added
 Click on graph for larger image.
This graph shows retail sales since 1992. This is monthly retail sales and food service, seasonally adjusted (total and ex-gasoline).
Retail sales ex-gasoline was down 0.8% in December.
The second graph shows the year-over-year change in retail sales and food service (ex-gasoline) since 1993.
Retail and Food service sales, ex-gasoline, increased by 1.4% on a YoY basis.
 The decrease in sales in January was below expectations, and sales in November and December were down.
Weekly Initial Unemployment Claims Decrease to 212,000
by Calculated Risk on 2/15/2024 08:30:00 AM
The DOL reported:
In the week ending February 10, the advance figure for seasonally adjusted initial claims was 212,000, a decrease of 8,000 from the previous week's revised level. The previous week's level was revised up by 2,000 from 218,000 to 220,000. The 4-week moving average was 218,500, an increase of 5,750 from the previous week's revised average. The previous week's average was revised up by 500 from 212,250 to 212,750.The following graph shows the 4-week moving average of weekly claims since 1971.
emphasis added
 Click on graph for larger image.
The dashed line on the graph is the current 4-week average. The four-week average of weekly unemployment claims increased to 218,500.
The previous week was revised up.
Weekly claims were at the consensus forecast.
Wednesday, February 14, 2024
Thursday: Retail Sales, Unemployment Claims, NY & Philly Fed Mfg, Industrial Production, Homebuilder Survey
by Calculated Risk on 2/14/2024 07:11:00 PM
 Note: Mortgage rates are from MortgageNewsDaily.com and are for top tier scenarios.
Thursday:
• At 8:30 AM ET, The initial weekly unemployment claims report will be released. The consensus is for 212 thousand initial claims, down from 218 thousand last week.
• Also at 8:30 AM, Retail sales for January is scheduled to be released. The consensus is for a 0.1% decrease in retail sales.
• Also at 8:30 AM, The New York Fed Empire State manufacturing survey for February. The consensus is for a reading of -12.5, up from -43.7.
• Also at 8:30 AM, The Philly Fed manufacturing survey for February. The consensus is for a reading of -8.0, up from -10.6.
• At 9:15 AM, The Fed will release Industrial Production and Capacity Utilization for January. The consensus is for a 0.3% increase in Industrial Production, and for Capacity Utilization to increase to 79.0%.
• At 10:00 AM,The February NAHB homebuilder survey. The consensus is for a reading of 46, up from 44. Any number below 50 indicates that more builders view sales conditions as poor than good.
LA Port Inbound Traffic Increased Year-over-year in January
by Calculated Risk on 2/14/2024 03:13:00 PM
Container traffic gives us an idea about the volume of goods being exported and imported - and usually some hints about the trade report since LA area ports handle about 40% of the nation's container port traffic.
The following graphs are for inbound and outbound traffic at the ports of Los Angeles and Long Beach in TEUs (TEUs: 20-foot equivalent units or 20-foot-long cargo container).
To remove the strong seasonal component for inbound traffic, the first graph shows the rolling 12-month average.
 Click on graph for larger image.
On a rolling 12-month basis, inbound traffic increased 1.6% in January compared to the rolling 12 months ending in December. Outbound traffic increased 0.2% compared to the rolling 12 months ending the previous month.
The 2nd graph is the monthly data (with a strong seasonal pattern for imports).
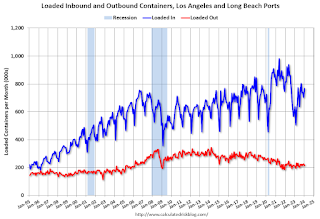 Usually imports peak in the July to October period as retailers import goods for the Christmas holiday, and then decline sharply and bottom in the Winter depending on the timing of the Chinese New Year.
 Usually imports peak in the July to October period as retailers import goods for the Christmas holiday, and then decline sharply and bottom in the Winter depending on the timing of the Chinese New Year.
 Imports were up 21% YoY in January, and exports were up 2% YoY. In 2023, the Chinese New Year was in January, and this year it was in February - so the timing of the New Year probably boosted inbound traffic in January.
In general, it appears port traffic is returning to the pre-pandemic patterns.
Part 2: Current State of the Housing Market; Overview for mid-February 2024
by Calculated Risk on 2/14/2024 10:48:00 AM
Today, in the Calculated Risk Real Estate Newsletter: Part 2: Current State of the Housing Market; Overview for mid-February 2024
A brief excerpt:
“If you do not know where you come from, then you don't know where you are, and if you don't know where you are, then you don't know where you're going. And if you don't know where you're going, you're probably going wrong.” Terry PratchettThere is much more in the article.
These “Current State” summaries show us where we came from, where we are, and hopefully give us clues as to where we are going!
Yesterday, in Part 1: Current State of the Housing Market; Overview for mid-February 2024 I reviewed home inventory, housing starts and sales.
...
Other measures of house prices suggest prices will be up further YoY in the December Case-Shiller index. The NAR reported median prices were up 4.4% YoY in December, up from 4.0% YoY in November. ICE (formerly Black Knight) reported prices were up 5.6% YoY in December, up from 5.1% YoY in November to new all-time highs, and Freddie Mac reported house prices were up 6.6% YoY in December, up from 6.1% YoY in November - and also to new all-time highs.
Here is a comparison of year-over-year change in the FMHPI, median house prices from the NAR, and the Case-Shiller National index.
The FMHPI and the NAR median prices appear to be leading indicators for Case-Shiller. Based on recent monthly data, and the FMHPI, the YoY change in the Case-Shiller index will increase further in the report for December.

MBA: Mortgage Applications Decreased in Weekly Survey
by Calculated Risk on 2/14/2024 07:00:00 AM
From the MBA: Mortgage Applications Decrease in Latest MBA Weekly Survey
Mortgage applications decreased 2.3 percent from one week earlier, according to data from the Mortgage Bankers Association’s (MBA) Weekly Mortgage Applications Survey for the week ending February 9, 2024.
The Market Composite Index, a measure of mortgage loan application volume, decreased 2.3 percent on a seasonally adjusted basis from one week earlier. On an unadjusted basis, the Index increased 2 percent compared with the previous week. The Refinance Index decreased 2 percent from the previous week and was 12 percent higher than the same week one year ago. The seasonally adjusted Purchase Index decreased 3 percent from one week earlier. The unadjusted Purchase Index increased 4 percent compared with the previous week and was 12 percent lower than the same week one year ago.
“Application activity was weaker last week, as mortgage rates moved higher across the board. The 30- year fixed mortgage rate was up to 6.87 percent – the highest rate since early December 2023,” said Joel Kan, MBA’s Vice President and Deputy Chief Economist. “Purchase applications remained subdued as elevated rates continue to add to affordability challenges along with still-low existing housing inventory. Refinance applications declined and remained depressed, with rates still higher than a year ago.”
...
The average contract interest rate for 30-year fixed-rate mortgages with conforming loan balances ($766,550 or less) increased to 6.87 percent from 6.80 percent, with points increasing to 0.65 from 0.59 (including the origination fee) for 80 percent loan-to-value ratio (LTV) loans.
emphasis added
 Click on graph for larger image.
The first graph shows the MBA mortgage purchase index.
According to the MBA, purchase activity is down 12% year-over-year unadjusted.
Red is a four-week average (blue is weekly).
Purchase application activity is up from the lows in late October and early November, but still at the lowest level during the housing bust.

The second graph shows the refinance index since 1990.
With higher mortgage rates, the refinance index declined sharply in 2022, and even with some recent minor increases, activity is barely off the bottom.
Tuesday, February 13, 2024
Wednesday: Mortgage Applications
by Calculated Risk on 2/13/2024 07:19:00 PM
 Note: Mortgage rates are from MortgageNewsDaily.com and are for top tier scenarios.
Wednesday:
• At 7:00 AM ET, The Mortgage Bankers Association (MBA) will release the results for the mortgage purchase applications index.


