 RSS Feed
 by Calculated Risk on 2/17/2024 08:11:00 AM
Saturday, February 17, 2024
Schedule for Week of February 18, 2024
The key report this week is January Existing Home sales.
All US markets will be closed in observance of Washington's Birthday.
No major economic releases scheduled.
7:00 AM ET: The Mortgage Bankers Association (MBA) will release the results for the mortgage purchase applications index.
During the day: The AIA's Architecture Billings Index for January (a leading indicator for commercial real estate).
2:00 PM: FOMC Minutes, Meeting of Meeting of January 30-31, 2024
8:30 AM: The initial weekly unemployment claims report will be released. The consensus is for 215 thousand initial claims, up from 212 thousand last week.
8:30 AM ET: Chicago Fed National Activity Index for January. This is a composite index of other data.
 10:00 AM: Existing Home Sales for January from the National Association of Realtors (NAR). The consensus is for 3.97 million SAAR, up from 3.78 million.
The graph shows existing home sales from 1994 through the report last month.
Housing economist Tom Lawler estimates the NAR will report sales of 4.02 million SAAR.
11:00 AM: the Kansas City Fed manufacturing survey for February.
No major economic releases scheduled.
Friday, February 16, 2024
Feb 16th COVID Update: Weekly Deaths Decreased
by Calculated Risk on 2/16/2024 08:11:00 PM
 Note: Mortgage rates are from MortgageNewsDaily.com and are for top tier scenarios.
Due to changes at the CDC, weekly cases are no longer updated.
For deaths, I'm currently using 4 weeks ago for "now", since the most recent three weeks will be revised significantly.
Hospitalizations have more than tripled from a low of 5,150 in June 2023, however, they have declined sharply from around 30,000 early this year.
| COVID Metrics | ||||
|---|---|---|---|---|
| Now | Week Ago | Goal | ||
| Hospitalized2 | 17,840 | 19,796 | ≤3,0001 | |
| Deaths per Week2 | 2,152 | 2,457 | ≤3501 | |
| 1my goals to stop weekly posts, 2Weekly for Currently Hospitalized, and Deaths 🚩 Increasing number weekly for Hospitalized and Deaths ✅ Goal met. | ||||
 Click on graph for larger image.
This graph shows the weekly (columns) number of deaths reported.
Weekly deaths have more than quadrupled from a low of 485 in early July. Still weekly deaths are far below the weekly peak of 26,000 in January 2021. Weekly deaths will likely decline soon.
 This appears to be a leading indicator for COVID hospitalizations and deaths.
Nationally, COVID in wastewater is now off more than 50% from the holiday peak at the end of December, and that suggests weekly deaths will continue to decline. The South region still has high levels of COVID in wastewater.
Lawler: Update on “Is the “Natural” Rate of Interest Back to Pre-Financial Crisis Levels”
by Calculated Risk on 2/16/2024 04:39:00 PM
Today, in the Calculated Risk Real Estate Newsletter: Lawler: Update on “Is the “Natural” Rate of Interest Back to Pre-Financial Crisis Levels”
A brief excerpt:
First, from housing economist Tom Lawler:There is more in the article.
Early Read on Existing Home Sales in January
Based on publicly-available local realtor/MLS reports released across the country through today, I project that existing home sales as estimated by the National Association of Realtors ran at a seasonally adjusted annual rate of 4.02 million in January, up 6.3% from December’s preliminary pace and up 0.5% from last January’s seasonally adjusted pace. Unadjusted sales should show a slightly higher YOY gain, reflecting this January’s higher business day count compared to last January’s.
Note that this month’s NAR release will incorporate updated seasonal adjustment factors for the previous few years.
Local realtor/MLS reports suggest that the median existing single-family home sales price last month was up by about 5.4%
Realtor.com Reports Active Inventory UP 13.9% YoY; New Listings up 9.5% YoY
by Calculated Risk on 2/16/2024 03:41:00 PM
Realtor.com has monthly and weekly data on the existing home market. Here is their weekly report: Weekly Housing Trends View — Data Week Ending February 10, 2024
• Active inventory increased, with for-sale homes 13.9% above year ago levels.
For a 14th consecutive week, active listings registered above prior year level, which means that today’s home shoppers have more homes to choose from that aren’t already in the process of being sold. The added inventory has certainly improved conditions from this time one year ago, but overall inventory is still low. For the month as a whole, January inventory is down nearly 40% below 2017 to 2019 levels.
• New listings–a measure of sellers putting homes up for sale–were up this week, by 9.5% from one year ago.
Newly listed homes were above last year’s levels for the 16th week in a row. While the jump was not as big as the one we observed in the previous week (12.8%), it was still an encouraging rate, which could further contribute to a recovery in active listings meaning more options for home shoppers
 Here is a graph of the year-over-year change in inventory according to realtor.com.
 Inventory was up year-over-year for the 14th consecutive week following 20 consecutive weeks with a YoY decrease in inventory.
Inventory is still historically very low.
New listings really collapsed a year ago, so the YoY comparison for new listings is easier now - although new listings remain well below "typical pre-pandemic levels", new listings are now up YoY for the 16th consecutive week.
GDP Tracking: Q1 Moving Down
by Calculated Risk on 2/16/2024 01:21:00 PM
From BofA:
Overall, this left our 1Q US GDP tracking estimate, which kicks off with today’s print at 0.9% q/q saar, one-tenth below our official forecast. Our 4Q tracking estimate declined by three-tenths to 3.1% q/q saar. [Feb 16th comment]From Goldman:
emphasis added
We lowered our Q1 GDP tracking estimate by 0.2pp to +2.3% (qoq ar) and our domestic final sales forecast by the same amount to +2.6%. We left out our past-quarter GDP tracking for Q4 unchanged at +3.2%, compared to +3.3% as previously reported. [Feb 16th estimate]And from the Altanta Fed: GDPNow
The GDPNow model estimate for real GDP growth (seasonally adjusted annual rate) in the first quarter of 2024 is 2.9 percent on February 16, unchanged from February 15. [Feb 16th estimate]
Single Family Starts Up 22% Year-over-year in January; Multi-Family Starts Down Sharply
by Calculated Risk on 2/16/2024 09:20:00 AM
Today, in the Calculated Risk Real Estate Newsletter: Single Family Starts Up 22% Year-over-year in January; Multi-Family Starts Down Sharply
A brief excerpt:
Note that permits held up better than starts in January, and housing starts were probably impacted by the severe weather last month.There is much more in the article.
...
The third graph shows the month-to-month comparison for total starts between 2023 (blue) and 2024 (red).
Total starts were down 0.7% in January compared to January 2023.
Starts were down year-over-year for 17 of the last 21 months, although starts were up year-over-year in 4 of the last 9 months.

Housing Starts Decreased to 1.331 million Annual Rate in January
by Calculated Risk on 2/16/2024 08:30:00 AM
From the Census Bureau: Permits, Starts and Completions
Housing Starts:
Privately‐owned housing starts in January were at a seasonally adjusted annual rate of 1,331,000. This is 14.8 percent below the revised December estimate of 1,562,000 and is 0.7 percent below the January 2023 rate of 1,340,000. Single‐family housing starts in January were at a rate of 1,004,000; this is 4.7 percent below the revised December figure of 1,054,000. The January rate for units in buildings with five units or more was 314,000.
Building Permits:
Privately‐owned housing units authorized by building permits in January were at a seasonally adjusted annual rate of 1,470,000. This is 1.5 percent below the revised December rate of 1,493,000, but is 8.6 percent above the January 2023 rate of 1,354,000. Single‐family authorizations in January were at a rate of 1,015,000; this is 1.6 percent above the revised December figure of 999,000. Authorizations of units in buildings with five units or more were at a rate of 405,000 in January.
emphasis added
 Click on graph for larger image.
The first graph shows single and multi-family housing starts since 2000.
Multi-family starts (blue, 2+ units) decreased in January compared to December. Multi-family starts were down 36.8% year-over-year in January.
Single-family starts (red) decreased in January and were up 22.0% year-over-year.
 The second graph shows single and multi-family housing starts since 1968.
 This shows the huge collapse following the housing bubble, and then the eventual recovery - and the recent collapse and recovery in single-family starts.
Total housing starts in January were below expectations, however, starts in November and December were revised up sharply, combined.
I'll have more later …
Thursday, February 15, 2024
Friday: Housing Starts, PPI
by Calculated Risk on 2/15/2024 07:11:00 PM
 Note: Mortgage rates are from MortgageNewsDaily.com and are for top tier scenarios.
Friday:
• At 8:30 AM ET, Housing Starts for January. The consensus is for 1.470 million SAAR, up from 1.460 million SAAR.
• Also at 8:30 AM, The Producer Price Index for January from the BLS. The consensus is for a 0.1% increase in PPI, and a 0.1% increase in core PPI.
• At 10:00 AM, University of Michigan's Consumer sentiment index (Preliminary for February). The consensus is for a reading of 79.0.
Fannie "Real Estate Owned" inventory Decreased in Q4 2023
by Calculated Risk on 2/15/2024 01:31:00 PM
Fannie reported results for Q4 2023. Here is some information on single-family Real Estate Owned (REOs).
Fannie Mae reported the number of REOs decreased to 8,403 at the end of Q4 2023, down 4% from 8,779 at the end of Q4 2022.
For Fannie, this is down 95% from the 166,787 peak number of REOs in Q3 2010.
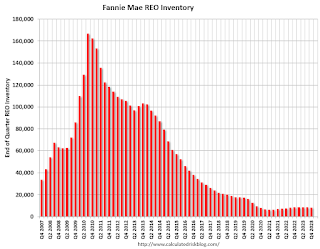 Click on graph for larger image.
Here is a graph of Fannie Real Estate Owned (REO).
This is well below the normal level of REOs for Fannie, and although REO levels might increase in 2024, there will not be a huge wave of foreclosures.
 Click on graph for larger image.
Here is a graph of Fannie Real Estate Owned (REO).
This is well below the normal level of REOs for Fannie, and although REO levels might increase in 2024, there will not be a huge wave of foreclosures.
NAHB: Builder Confidence Increased in February
by Calculated Risk on 2/15/2024 10:00:00 AM
The National Association of Home Builders (NAHB) reported the housing market index (HMI) was at 48, up from 44 last month. Any number below 50 indicates that more builders view sales conditions as poor than good.
From the NAHB: Builder Sentiment Posts Third Consecutive Monthly Gain
Expectations that mortgage rates will continue to moderate in the coming months, the prospect of future rate cuts by the Federal Reserve later this year, and a protracted lack of existing inventory helped provide a boost to builder sentiment for the third straight month.
Builder confidence in the market for newly built single-family homes climbed four points to 48 in February, according to the National Association of Home Builders (NAHB)/Wells Fargo Housing Market Index (HMI) released today. This is the highest level since August 2023.
“Buyer traffic is improving as even small declines in interest rates will produce a disproportionate positive response among likely home purchasers,” said NAHB Chairman Alicia Huey, a custom home builder and developer from Birmingham, Ala. “And while mortgage rates still remain too high for many prospective buyers, we anticipate that due to pent-up demand, many more buyers will enter the marketplace if mortgage rates continue to decline this year.”
“With future expectations of Fed rate cuts in the latter half of 2024, NAHB is forecasting that single-family starts will rise about 5% this year,” said NAHB Chief Economist Robert Dietz. “But as builders break ground on more homes, lot availability is expected to be a growing concern, along with persistent labor shortages. And as a further reminder that the recovery will be bumpy as buyers remain sensitive to interest rate and construction cost changes, the 10-year Treasury rate is up more than 40 basis points since the beginning of the year.”
With mortgage rates now below 7% since mid-December, more builders are cutting back on reducing home prices to boost sales. In February, 25% of builders reported cutting home prices, down from 31% in January and 36% in the last two months of 2023. However, the average price reduction in February held steady at 6% for the eighth straight month. Meanwhile, the use of sales incentives is also diminishing. The share of builders offering some form of incentive dropped to 58% in February, down from 62% in January and the lowest share since last August.
...
All three of the major HMI indices posted gains in February. The HMI index charting current sales conditions increased four points to 52, the component measuring sales expectations in the next six months rose three points to 60 and the component gauging traffic of prospective buyers increased four points to 33.
Looking at the three-month moving averages for regional HMI scores, the Northeast increased three points to 57, the Midwest gained two points to 36, the South rose five points to 46 and the West registered a six-point gain to 38.
emphasis added
 Click on graph for larger image.
This graph shows the NAHB index since Jan 1985.
This was above the consensus forecast.


