by Calculated Risk on 2/20/2024 08:59:00 AM
Tuesday, February 20, 2024
Existing Home Sales: Lawler vs. the Consensus
Housing economist Tom Lawler has been sending me his predictions of what the NAR will report for almost 14 years. He has graciously allowed me to share his predictions with the readers of this blog.
The table below shows the consensus for each month, Lawler's predictions, and the NAR's initially reported level of sales. Lawler hasn't always been closer than the consensus, but usually when there has been a fairly large spread between Lawler's estimate and the "consensus", Lawler has been closer.
| Existing Home Sales, Forecasts and NAR Report millions, seasonally adjusted annual rate basis (SAAR) | |||
|---|---|---|---|
| Month | Consensus | Lawler | NAR reported1 |
| May-10 | 6.20 | 5.83 | 5.66 |
| Jun-10 | 5.30 | 5.30 | 5.37 |
| Jul-10 | 4.66 | 3.95 | 3.83 |
| Aug-10 | 4.10 | 4.10 | 4.13 |
| Sep-10 | 4.30 | 4.50 | 4.53 |
| Oct-10 | 4.50 | 4.46 | 4.43 |
| Nov-10 | 4.85 | 4.61 | 4.68 |
| Dec-10 | 4.90 | 5.13 | 5.28 |
| Jan-11 | 5.20 | 5.17 | 5.36 |
| Feb-11 | 5.15 | 5.00 | 4.88 |
| Mar-11 | 5.00 | 5.08 | 5.10 |
| Apr-11 | 5.20 | 5.15 | 5.05 |
| May-11 | 4.75 | 4.80 | 4.81 |
| Jun-11 | 4.90 | 4.71 | 4.77 |
| Jul-11 | 4.92 | 4.69 | 4.67 |
| Aug-11 | 4.75 | 4.92 | 5.03 |
| Sep-11 | 4.93 | 4.83 | 4.91 |
| Oct-11 | 4.80 | 4.86 | 4.97 |
| Nov-11 | 5.08 | 4.40 | 4.42 |
| Dec-11 | 4.60 | 4.64 | 4.61 |
| Jan-12 | 4.69 | 4.66 | 4.57 |
| Feb-12 | 4.61 | 4.63 | 4.59 |
| Mar-12 | 4.62 | 4.59 | 4.48 |
| Apr-12 | 4.66 | 4.53 | 4.62 |
| May-12 | 4.57 | 4.66 | 4.55 |
| Jun-12 | 4.65 | 4.56 | 4.37 |
| Jul-12 | 4.50 | 4.47 | 4.47 |
| Aug-12 | 4.55 | 4.87 | 4.82 |
| Sep-12 | 4.75 | 4.70 | 4.75 |
| Oct-12 | 4.74 | 4.84 | 4.79 |
| Nov-12 | 4.90 | 5.10 | 5.04 |
| Dec-12 | 5.10 | 4.97 | 4.94 |
| Jan-13 | 4.90 | 4.94 | 4.92 |
| Feb-13 | 5.01 | 4.87 | 4.98 |
| Mar-13 | 5.03 | 4.89 | 4.92 |
| Apr-13 | 4.92 | 5.03 | 4.97 |
| May-13 | 5.00 | 5.20 | 5.18 |
| Jun-13 | 5.27 | 4.99 | 5.08 |
| Jul-13 | 5.13 | 5.33 | 5.39 |
| Aug-13 | 5.25 | 5.35 | 5.48 |
| Sep-13 | 5.30 | 5.26 | 5.29 |
| Oct-13 | 5.13 | 5.08 | 5.12 |
| Nov-13 | 5.02 | 4.98 | 4.90 |
| Dec-13 | 4.90 | 4.96 | 4.87 |
| Jan-14 | 4.70 | 4.67 | 4.62 |
| Feb-14 | 4.64 | 4.60 | 4.60 |
| Mar-14 | 4.56 | 4.64 | 4.59 |
| Apr-14 | 4.67 | 4.70 | 4.65 |
| May-14 | 4.75 | 4.81 | 4.89 |
| Jun-14 | 4.99 | 4.96 | 5.04 |
| Jul-14 | 5.00 | 5.09 | 5.15 |
| Aug-14 | 5.18 | 5.12 | 5.05 |
| Sep-14 | 5.09 | 5.14 | 5.17 |
| Oct-14 | 5.15 | 5.28 | 5.26 |
| Nov-14 | 5.20 | 4.90 | 4.93 |
| Dec-14 | 5.05 | 5.15 | 5.04 |
| Jan-15 | 5.00 | 4.90 | 4.82 |
| Feb-15 | 4.94 | 4.87 | 4.88 |
| Mar-15 | 5.04 | 5.18 | 5.19 |
| Apr-15 | 5.22 | 5.20 | 5.04 |
| May-15 | 5.25 | 5.29 | 5.35 |
| Jun-15 | 5.40 | 5.45 | 5.49 |
| Jul-15 | 5.41 | 5.64 | 5.59 |
| Aug-15 | 5.50 | 5.54 | 5.31 |
| Sep-15 | 5.35 | 5.56 | 5.55 |
| Oct-15 | 5.41 | 5.33 | 5.36 |
| Nov-15 | 5.32 | 4.97 | 4.76 |
| Dec-15 | 5.19 | 5.36 | 5.46 |
| Jan-16 | 5.32 | 5.36 | 5.47 |
| Feb-16 | 5.30 | 5.20 | 5.08 |
| Mar-16 | 5.27 | 5.27 | 5.33 |
| Apr-16 | 5.40 | 5.44 | 5.45 |
| May-16 | 5.64 | 5.55 | 5.53 |
| Jun-16 | 5.48 | 5.62 | 5.57 |
| Jul-16 | 5.52 | 5.41 | 5.39 |
| Aug-16 | 5.44 | 5.49 | 5.33 |
| Sep-16 | 5.35 | 5.55 | 5.47 |
| Oct-16 | 5.44 | 5.47 | 5.60 |
| Nov-16 | 5.54 | 5.60 | 5.61 |
| Dec-16 | 5.54 | 5.55 | 5.49 |
| Jan-17 | 5.55 | 5.60 | 5.69 |
| Feb-17 | 5.55 | 5.41 | 5.48 |
| Mar-17 | 5.61 | 5.74 | 5.71 |
| Apr-17 | 5.67 | 5.56 | 5.57 |
| May-17 | 5.55 | 5.65 | 5.62 |
| Jun-17 | 5.58 | 5.59 | 5.52 |
| Jul-17 | 5.57 | 5.38 | 5.44 |
| Aug-17 | 5.48 | 5.39 | 5.35 |
| Sep-17 | 5.30 | 5.38 | 5.39 |
| Oct-17 | 5.30 | 5.60 | 5.48 |
| Nov-17 | 5.52 | 5.77 | 5.81 |
| Dec-17 | 5.75 | 5.66 | 5.57 |
| Jan-18 | 5.65 | 5.48 | 5.38 |
| Feb-18 | 5.42 | 5.44 | 5.54 |
| Mar-18 | 5.28 | 5.51 | 5.60 |
| Apr-18 | 5.60 | 5.48 | 5.46 |
| May-18 | 5.56 | 5.47 | 5.43 |
| Jun-18 | 5.45 | 5.35 | 5.38 |
| Jul-18 | 5.43 | 5.40 | 5.34 |
| Aug-18 | 5.36 | 5.36 | 5.34 |
| Sep-18 | 5.30 | 5.20 | 5.15 |
| Oct-18 | 5.20 | 5.31 | 5.22 |
| Nov-18 | 5.19 | 5.23 | 5.32 |
| Dec-18 | 5.24 | 4.97 | 4.99 |
| Jan-19 | 5.05 | 4.92 | 4.94 |
| Feb-19 | 5.08 | 5.46 | 5.51 |
| Mar-19 | 5.30 | 5.40 | 5.21 |
| Apr-19 | 5.36 | 5.31 | 5.19 |
| May-19 | 5.29 | 5.40 | 5.34 |
| Jun-19 | 5.34 | 5.25 | 5.27 |
| Jul-19 | 5.39 | 5.40 | 5.42 |
| Aug-19 | 5.38 | 5.42 | 5.49 |
| Sep-19 | 5.45 | 5.36 | 5.38 |
| Oct-19 | 5.49 | 5.36 | 5.46 |
| Nov-19 | 5.45 | 5.43 | 5.35 |
| Dec-19 | 5.43 | 5.40 | 5.54 |
| Jan-20 | 5.45 | 5.42 | 5.46 |
| Feb-20 | 5.50 | 5.58 | 5.77 |
| Mar-20 | 5.30 | 5.25 | 5.27 |
| Apr-20 | 4.30 | 4.17 | 4.33 |
| May-20 | 4.38 | 3.80 | 3.91 |
| Jun-20 | 4.86 | 4.65 | 4.72 |
| Jul-20 | 5.39 | 5.85 | 5.86 |
| Aug-20 | 6.00 | 5.92 | 6.00 |
| Sep-20 | 6.25 | 6.38 | 6.54 |
| Oct-20 | 6.45 | 6.63 | 6.85 |
| Nov-20 | 6.70 | 6.50 | 6.69 |
| Dec-20 | 6.55 | 6.62 | 6.76 |
| Jan-21 | 6.60 | 6.48 | 6.69 |
| Feb-21 | 6.51 | 6.29 | 6.22 |
| Mar-21 | 6.17 | 6.02 | 6.01 |
| Apr-21 | 6.09 | 5.96 | 5.85 |
| May-21 | 5.74 | 5.78 | 5.80 |
| Jun-21 | 5.90 | 5.79 | 5.86 |
| Jul-21 | 5.84 | 5.86 | 5.99 |
| Aug-21 | 5.88 | 5.90 | 5.88 |
| Sep-21 | 6.06 | 6.20 | 6.29 |
| Oct-21 | 6.20 | 6.34 | 6.34 |
| Nov-21 | 6.20 | 6.45 | 6.46 |
| Dec-21 | 6.45 | 6.33 | 6.18 |
| Jan-22 | 6.12 | 6.36 | 6.50 |
| Feb-22 | 6.16 | 5.97 | 6.02 |
| Mar-22 | 5.80 | 5.74 | 5.77 |
| Apr-22 | 5.62 | 5.57 | 5.61 |
| May-22 | 5.41 | 5.35 | 5.41 |
| Jun-22 | 5.40 | 5.12 | 5.12 |
| Jul-22 | 4.88 | 4.90 | 4.81 |
| Aug-22 | 4.70 | 4.84 | 4.80 |
| Sep-22 | 4.69 | 4.82 | 4.71 |
| Oct-22 | 4.39 | 4.49 | 4.43 |
| Nov-22 | 4.20 | 4.16 | 4.09 |
| Dec-22 | 3.95 | 3.96 | 4.02 |
| Jan-23 | 4.10 | 4.18 | 4.00 |
| Feb-23 | 4.18 | 4.51 | 4.58 |
| Mar-23 | 4.50 | 4.51 | 4.44 |
| Apr-23 | 4.30 | 4.33 | 4.28 |
| May-23 | 4.24 | 4.25 | 4.30 |
| Jun-23 | 4.23 | 4.26 | 4.16 |
| Jul-23 | 4.15 | 4.06 | 4.07 |
| Aug-23 | 4.10 | 4.07 | 4.04 |
| Sep-23 | 3.94 | 4.00 | 3.96 |
| Oct-23 | 3.93 | 3.94 | 3.79 |
| Nov-23 | 3.78 | 3.87 | 3.82 |
| Dec-23 | 3.84 | 3.84 | 3.78 |
| Jan-24 | 3.97 | 4.02 | NA |
| 1NAR initially reported before revisions. | |||
Monday, February 19, 2024
Tuesday: No major economic releases scheduled
by Calculated Risk on 2/19/2024 06:18:00 PM
Weekend:
• Schedule for Week of February 18, 2024
Tuesday:
• No major economic releases scheduled.
From CNBC: Pre-Market Data and Bloomberg futures S&P 500 and DOW futures are mostly unchanged (fair value).
Oil prices were up over the last week with WTI futures at $79.28 per barrel and Brent at $83.28 per barrel. A year ago, WTI was at $76, and Brent was at $83 - so WTI oil prices were up 4% year-over-year.
Here is a graph from Gasbuddy.com for nationwide gasoline prices. Nationally prices are at $3.25 per gallon. A year ago, prices were at $3.36 per gallon, so gasoline prices are down $0.11 year-over-year.
3rd Look at Local Housing Markets in January; California Home Sales Up 5.9% YoY in January
by Calculated Risk on 2/19/2024 11:02:00 AM
Today, in the Calculated Risk Real Estate Newsletter: 3rd Look at Local Housing Markets in January; California Home Sales Up 5.9% YoY in January
A brief excerpt:
NOTE: The tables for active listings, new listings and closed sales all include a comparison to January 2019 for each local market (some 2019 data is not available).There is much more in the article.
This is the third look at several local markets in January. I’m tracking about 40 local housing markets in the US. Some of the 40 markets are states, and some are metropolitan areas. I’ll update these tables throughout the month as additional data is released.
...
Note: The National Association of Realtors (NAR) is scheduled to release January existing home sales on Thursday, February 22nd, at 10:00 AM ET. The consensus is for 3.97 million SAAR, up from 3.78 million.
Housing economist Tom Lawler expects the NAR to report sales of 4.02 million SAAR for January.
...
And a table of January sales.
In January, sales in these markets were up 3.0%. In December, these same markets were down 7.3% year-over-year Not Seasonally Adjusted (NSA).
Sales in most of these markets are down sharply compared to January 2019.
...
More local markets to come!
Housing February 19th Weekly Update: Inventory Down 0.2% Week-over-week, Up 12.9% Year-over-year
by Calculated Risk on 2/19/2024 08:12:00 AM
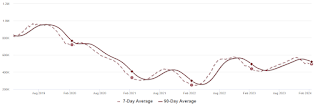 Click on graph for larger image.
This inventory graph is courtesy of Altos Research.

Sunday, February 18, 2024
Hotels: Occupancy Rate Decreased 2.7% Year-over-year
by Calculated Risk on 2/18/2024 08:31:00 AM
U.S. hotel performance increased from the previous week, while year-over-year comparisons remained mixed, according to CoStar’s latest data through 10 February. ...The following graph shows the seasonal pattern for the hotel occupancy rate using the four-week average.
4-10 February 2024 (percentage change from comparable week in 2023):
• Occupancy: 56.2% (-2.7%)
• Average daily rate (ADR): US$160.96 (+6.8%)
• Revenue per available room (RevPAR): US$90.40 (+3.9%)
emphasis added
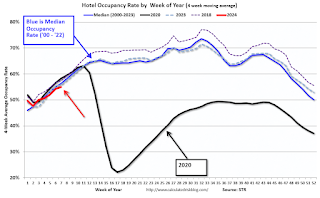 Click on graph for larger image.
The red line is for 2024, black is 2020, blue is the median, and dashed light blue is for 2023. Dashed purple is for 2018, the record year for hotel occupancy.
Saturday, February 17, 2024
Real Estate Newsletter Articles this Week: Current State of the Housing Market for Mid-February
by Calculated Risk on 2/17/2024 02:11:00 PM
At the Calculated Risk Real Estate Newsletter this week:
• Single Family Starts Up 22% Year-over-year in January; Multi-Family Starts Down Sharply
• Part 1: Current State of the Housing Market; Overview for mid-February 2024
• Part 2: Current State of the Housing Market; Overview for mid-February 2024
• 2nd Look at Local Housing Markets in January
• Lawler: Update on “Is the “Natural” Rate of Interest Back to Pre-Financial Crisis Levels” Early Read on Existing Home Sales in January
This is usually published 4 to 6 times a week and provides more in-depth analysis of the housing market.
Schedule for Week of February 18, 2024
by Calculated Risk on 2/17/2024 08:11:00 AM
The key report this week is January Existing Home sales.
All US markets will be closed in observance of Washington's Birthday.
No major economic releases scheduled.
7:00 AM ET: The Mortgage Bankers Association (MBA) will release the results for the mortgage purchase applications index.
During the day: The AIA's Architecture Billings Index for January (a leading indicator for commercial real estate).
2:00 PM: FOMC Minutes, Meeting of Meeting of January 30-31, 2024
8:30 AM: The initial weekly unemployment claims report will be released. The consensus is for 215 thousand initial claims, up from 212 thousand last week.
8:30 AM ET: Chicago Fed National Activity Index for January. This is a composite index of other data.
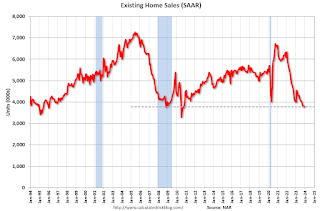 10:00 AM: Existing Home Sales for January from the National Association of Realtors (NAR). The consensus is for 3.97 million SAAR, up from 3.78 million.
The graph shows existing home sales from 1994 through the report last month.
Housing economist Tom Lawler estimates the NAR will report sales of 4.02 million SAAR.
11:00 AM: the Kansas City Fed manufacturing survey for February.
No major economic releases scheduled.
Friday, February 16, 2024
Feb 16th COVID Update: Weekly Deaths Decreased
by Calculated Risk on 2/16/2024 08:11:00 PM
| COVID Metrics | ||||
|---|---|---|---|---|
| Now | Week Ago | Goal | ||
| Hospitalized2 | 17,840 | 19,796 | ≤3,0001 | |
| Deaths per Week2 | 2,152 | 2,457 | ≤3501 | |
| 1my goals to stop weekly posts, 2Weekly for Currently Hospitalized, and Deaths 🚩 Increasing number weekly for Hospitalized and Deaths ✅ Goal met. | ||||
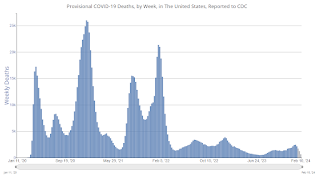 Click on graph for larger image.
This graph shows the weekly (columns) number of deaths reported.
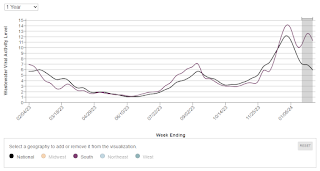 This appears to be a leading indicator for COVID hospitalizations and deaths.
Lawler: Update on “Is the “Natural” Rate of Interest Back to Pre-Financial Crisis Levels”
by Calculated Risk on 2/16/2024 04:39:00 PM
Today, in the Calculated Risk Real Estate Newsletter: Lawler: Update on “Is the “Natural” Rate of Interest Back to Pre-Financial Crisis Levels”
A brief excerpt:
First, from housing economist Tom Lawler:There is more in the article.
Early Read on Existing Home Sales in January
Based on publicly-available local realtor/MLS reports released across the country through today, I project that existing home sales as estimated by the National Association of Realtors ran at a seasonally adjusted annual rate of 4.02 million in January, up 6.3% from December’s preliminary pace and up 0.5% from last January’s seasonally adjusted pace. Unadjusted sales should show a slightly higher YOY gain, reflecting this January’s higher business day count compared to last January’s.
Note that this month’s NAR release will incorporate updated seasonal adjustment factors for the previous few years.
Local realtor/MLS reports suggest that the median existing single-family home sales price last month was up by about 5.4%
Realtor.com Reports Active Inventory UP 13.9% YoY; New Listings up 9.5% YoY
by Calculated Risk on 2/16/2024 03:41:00 PM
Realtor.com has monthly and weekly data on the existing home market. Here is their weekly report: Weekly Housing Trends View — Data Week Ending February 10, 2024
• Active inventory increased, with for-sale homes 13.9% above year ago levels.
For a 14th consecutive week, active listings registered above prior year level, which means that today’s home shoppers have more homes to choose from that aren’t already in the process of being sold. The added inventory has certainly improved conditions from this time one year ago, but overall inventory is still low. For the month as a whole, January inventory is down nearly 40% below 2017 to 2019 levels.
• New listings–a measure of sellers putting homes up for sale–were up this week, by 9.5% from one year ago.
Newly listed homes were above last year’s levels for the 16th week in a row. While the jump was not as big as the one we observed in the previous week (12.8%), it was still an encouraging rate, which could further contribute to a recovery in active listings meaning more options for home shoppers
 Here is a graph of the year-over-year change in inventory according to realtor.com.
 Inventory was up year-over-year for the 14th consecutive week following 20 consecutive weeks with a YoY decrease in inventory.


