 RSS Feed
 by Calculated Risk on 2/29/2024 02:32:00 PM
Thursday, February 29, 2024
Las Vegas January 2024: Visitor Traffic Up 3% YoY; Convention Traffic Up 9%
From the Las Vegas Visitor Authority: January 2024 Las Vegas Visitor Statistics
With a room inventory with roughly 4,300 more rooms than last year, est. visitor volume reached 3.38M, up 3.3% YoY.
Despite the larger room inventory vs. Jan 2023, overall hotel occupancy for the month was on par with last January at 78.9% (down ‐0.2 pts). Affected in part by the move of the CES tradeshow back to midweek dates this January instead of the weekend dates it spanned last January, Weekend occupancy for the month declined to 83.6% (down ‐4.8 pts) while Midweek occupancy increased to 77%, +1.8 pts YoY.
ADR for the month matched last January at approx. $191 while RevPAR saw a modest YoY decline to just under $151, ‐0.5%.
emphasis added
 Click on graph for larger image.
 The first graph shows visitor traffic for 2019 (Black), 2020 (dark blue), 2021 (light blue), 2022 (light orange), 2023 (dark orange) and 2024 (red).
Visitor traffic was up 3.3% compared to last January. Visitor traffic was down 0.8% compared to the same month in 2019.
The second graph shows convention traffic.

Convention traffic was up 8.6% compared to January 2023, and down 18.5% compared to January 2019. 
Note: There was almost no convention traffic from April 2020 through May 2021.
NAR: Pending Home Sales Decrease 4.9% in January; Down 8.8% Year-over-year
by Calculated Risk on 2/29/2024 10:00:00 AM
From the NAR: Pending Home Sales Receded 4.9% in January
Pending home sales in January dropped 4.9%, according to the National Association of REALTORS®. The Northeast and West posted monthly gains in transactions while the Midwest and South recorded losses. All four U.S. regions registered year-over-year decreases.This was well below expectations. Note: Contract signings usually lead sales by about 45 to 60 days, so this would usually be for closed sales in February and March.
The Pending Home Sales Index (PHSI)* – a forward-looking indicator of home sales based on contract signings – decreased to 74.3 in January. Year over year, pending transactions were down 8.8%. An index of 100 is equal to the level of contract activity in 2001.
...
The Northeast PHSI increased 0.8% from last month to 63.6, a decline of 5.5% from January 2023. The Midwest index decreased 7.6% to 73.7 in January, down 11.6% from one year ago.
The South PHSI declined 7.3% to 88.5 in January, falling 9.0% from the prior year. The West index rose 0.5% in January to 61.1, down 7.0% from January 2023.
emphasis added
PCE Measure of Shelter Slows to 6.1% YoY in January
by Calculated Risk on 2/29/2024 09:09:00 AM
Here is a graph of the year-over-year change in shelter from the CPI report and housing from the PCE report this morning, both through January 2024.
 CPI Shelter was up 6.1% year-over-year in January, down from 6.2% in December, and down from the cycle peak of 8.2% in March 2023.
Housing (PCE) was up 6.1% YoY in January, down from 6.3% in December, and down from the cycle peak of 8.3% in April 2023.
Since asking rents are mostly flat year-over-year, these measures will continue to slow over coming months.
Since asking rents are mostly flat year-over-year, these measures will continue to slow over coming months.
The second graph shows PCE prices, Core PCE prices and Core ex-housing over the last 6 months (annualized):
 Key measures are now close to the Fed's target on a 6-month basis.
PCE Price Index: 2.5%
Core PCE Prices: 2.5%
Core minus Housing: 1.8%
Personal Income increased 1.0% in January; Spending increased 0.2%
by Calculated Risk on 2/29/2024 08:35:00 AM
The BEA released the Personal Income and Outlays report for January:
Personal income increased $233.7 billion (1.0 percent at a monthly rate) in January, according to estimates released today by the Bureau of Economic Analysis. Disposable personal income (DPI), personal income less personal current taxes, increased $67.6 billion (0.3 percent) and personal consumption expenditures (PCE) increased $43.9 billion (0.2 percent).The January PCE price index increased 2.4 percent year-over-year (YoY), down from 2.6 percent YoY in December, and down from the recent peak of 7.1 percent in June 2022.
The PCE price index increased 0.3 percent. Excluding food and energy, the PCE price index increased 0.4 percent. Real DPI decreased less than 0.1 percent in January and real PCE decreased 0.1 percent; goods decreased 1.1 percent and services increased 0.4 percent.
emphasis added
The PCE price index, excluding food and energy, increased 2.8 percent YoY, down from 2.9 percent in December, and down from the recent peak of 5.6 percent in February 2022.
The following graph shows real Personal Consumption Expenditures (PCE) through January 2024 (2017 dollars). Note that the y-axis doesn't start at zero to better show the change.
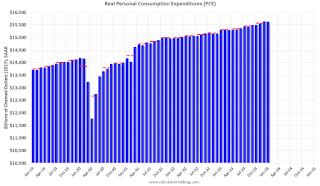 Click on graph for larger image.
The dashed red lines are the quarterly levels for real PCE.
Personal income was above expectations and PCE was at expectations.
Inflation was slightly above expectations.
Weekly Initial Unemployment Claims Increase to 215,000
by Calculated Risk on 2/29/2024 08:30:00 AM
The DOL reported:
In the week ending February 24, the advance figure for seasonally adjusted initial claims was 215,000, an increase of 13,000 from the previous week's revised level. The previous week's level was revised up by 1,000 from 201,000 to 202,000. The 4-week moving average was 212,500, a decrease of 3,000 from the previous week's revised average. The previous week's average was revised up by 250 from 215,250 to 215,500.The following graph shows the 4-week moving average of weekly claims since 1971.
emphasis added
 Click on graph for larger image.
The dashed line on the graph is the current 4-week average. The four-week average of weekly unemployment claims decreased to 212,500.
The previous week was revised up.
Weekly claims were above the consensus forecast.
Wednesday, February 28, 2024
Thursday: Personal Income & Outlays, Unemployment Claims, Pending Home Sales, Chicago PMI
by Calculated Risk on 2/28/2024 06:51:00 PM
 Note: Mortgage rates are from MortgageNewsDaily.com and are for top tier scenarios.
Thursday:
• At 8:30 AM ET, The initial weekly unemployment claims report will be released. The consensus is for 195 thousand initial claims, down from 201 thousand last week.
• Also at 8:30 AM, Personal Income and Outlays for January. The consensus is for a 0.5% increase in personal income, and for a 0.2% increase in personal spending. And for the Core PCE price index to increase 0.4%. PCE prices are expected to be up 2.4% YoY, and core PCE prices up 2.8% YoY.
• At 9:45 AM, Chicago Purchasing Managers Index for February.
• At 10:00 AM, Pending Home Sales Index for January. The consensus is for a 1.0% increase in the index.
• At 11:00 AM, the Kansas City Fed manufacturing survey for February.
Freddie Reports Surge in Multifamily Serious Delinquencies
by Calculated Risk on 2/28/2024 12:33:00 PM
Today, in the Calculated Risk Real Estate Newsletter: Freddie Reports Surge in Multifamily Serious Delinquencies
Brief excerpt:
Freddie Mac reports that the multi-family serious delinquency rate increased sharply in January to 0.44% from 0.28% in December, and up from 0.12% in January 2023.
This graph shows the Freddie multi-family serious delinquency rate since 2012.

There ismore in the article.
Q4 GDP Growth Revised Down to 3.2% Annual Rate
by Calculated Risk on 2/28/2024 08:30:00 AM
From the BEA: Gross Domestic Product, Fourth Quarter and Year 2023 (Second Estimate)
Real gross domestic product (GDP) increased at an annual rate of 3.2 percent in the fourth quarter of 2023, according to the "second" estimate released by the Bureau of Economic Analysis. In the third quarter, real GDP increased 4.9 percent.Here is a Comparison of Second and Advance Estimates. PCE growth was revised up from 2.8% to 3.0%. Residential investment was revised up from 1.1% to 2.9%.
The GDP estimate released today is based on more complete source data than were available for the "advance" estimate issued last month. In the advance estimate, the increase in real GDP was 3.3 percent. The update primarily reflected a downward revision to private inventory investment that was partly offset by upward revisions to state and local government spending and consumer spending (refer to "Updates to GDP").
The increase in real GDP reflected increases in consumer spending, exports, state and local government spending, nonresidential fixed investment, federal government spending, and residential fixed investment that were partly offset by a decrease in private inventory investment. Imports, which are a subtraction in the calculation of GDP, increased.
emphasis added
MBA: Mortgage Applications Decreased in Weekly Survey, "Activity stalled"
by Calculated Risk on 2/28/2024 07:00:00 AM
"Higher rates in recent weeks have stalled activity", Mike Fratantoni, MBA’s SVP and Chief Economist.
Mortgage applications decreased 5.6 percent from one week earlier, according to data from the Mortgage Bankers Association’s (MBA) Weekly Mortgage Applications Survey for the week ending February 23, 2024.
The Market Composite Index, a measure of mortgage loan application volume, decreased 5.6 percent on a seasonally adjusted basis from one week earlier. On an unadjusted basis, the Index decreased 3 percent compared with the previous week. The Refinance Index decreased 7 percent from the previous week and was 1 percent lower than the same week one year ago. The seasonally adjusted Purchase Index decreased 5 percent from one week earlier. The unadjusted Purchase Index decreased 1 percent compared with the previous week and was 12 percent lower than the same week one year ago.
“Mortgage rates were little changed last week, with the 30-year conforming rate declining slightly to 7.04 percent but remaining about a quarter percentage point higher than the start of the year,” said Mike Fratantoni, MBA’s SVP and Chief Economist. “Higher rates in recent weeks have stalled activity, and last week it dropped more for those seeking FHA and VA refinances. Purchase activity is running 12 percent behind last year’s pace, but our January Builder Application Survey results showed that applications to buy new homes were up 19 percent compared to last year. This disparity continues to highlight how the lack of existing inventory is the primary constraint to increases in purchase volume. However, mortgage rates above 7 percent sure don’t help.”
...
The average contract interest rate for 30-year fixed-rate mortgages with conforming loan balances ($766,550 or less) decreased to 7.04 percent from 7.06 percent, with points increasing to 0.67 from 0.66 (including the origination fee) for 80 percent loan-to-value ratio (LTV) loans.
emphasis added
 Click on graph for larger image.
The first graph shows the MBA mortgage purchase index.
According to the MBA, purchase activity is down 12% year-over-year unadjusted.
Red is a four-week average (blue is weekly).
Purchase application activity is up slightly from the lows in late October 2023, and below the lowest levels during the housing bust. Other than two weeks last October, this is the lowest level since 1995.

The second graph shows the refinance index since 1990.
With higher mortgage rates, the refinance index declined sharply in 2022, and has mostly flatlined since then.
Tuesday, February 27, 2024
Wednesday: GDP
by Calculated Risk on 2/27/2024 07:26:00 PM
 Note: Mortgage rates are from MortgageNewsDaily.com and are for top tier scenarios.
Wednesday:
• At 7:00 AM ET, The Mortgage Bankers Association (MBA) will release the results for the mortgage purchase applications index.
• At 8:30 AM, Gross Domestic Product, 4th Quarter and Year 2023 (Second Estimate) The consensus is that real GDP increased 3.3% annualized in Q4, unchanged from the advance estimate of 3.3%.


