 RSS Feed
 by Calculated Risk on 3/01/2024 01:01:00 PM
Friday, March 01, 2024
Fannie and Freddie: Single Family Serious Delinquency Rate Decreases Slightly in January
Freddie Mac reported that the Single-Family serious delinquency rate in January was 0.55%, unchanged from 0.55% December. Freddie's rate is down year-over-year from 0.66% in January 2023. This is below the pre-pandemic lows. Freddie's serious delinquency rate peaked in February 2010 at 4.20% following the housing bubble and peaked at 3.17% in August 2020 during the pandemic.
Fannie Mae reported that the Single-Family Serious Delinquency decreased to 0.54% in January from 0.55% in December. The serious delinquency rate is down from 0.64% in January 2023. This is below the pre-pandemic lows. The Fannie Mae serious delinquency rate peaked in February 2010 at 5.59% following the housing bubble and peaked at 3.32% in August 2020 during the pandemic.
 Click on graph for larger image.
These are mortgage loans that are "three monthly payments or more past due or in foreclosure". Mortgages in forbearance are being counted as delinquent in this monthly report but are not reported to the credit bureaus.
For Fannie, by vintage, for loans made in 2004 or earlier (1% of portfolio), 1.62% are seriously delinquent (down from 1.67% the previous month).
For loans made in 2005 through 2008 (1% of portfolio), 2.44% are seriously delinquent (down from 2.53%).
For recent loans, originated in 2009 through 2023 (98% of portfolio), 0.47% are seriously delinquent (unchanged from 0.47%).
Construction Spending Decreased 0.2% in January
by Calculated Risk on 3/01/2024 10:15:00 AM
From the Census Bureau reported that overall construction spending increased:
Construction spending during January 2024 was estimated at a seasonally adjusted annual rate of $2,102.4 billion, 0.2 percent below the revised December estimate of $2,105.8 billion. The January figure is 11.7 percent above the January 2023 estimate of $1,882.2 billion.Private spending increased and public spending decreased:
emphasis added
Spending on private construction was at a seasonally adjusted annual rate of $1,623.4 billion, 0.1 percent above the revised December estimate of $1,622.3 billion. ...
In January, the estimated seasonally adjusted annual rate of public construction spending was $479.0 billion, 0.9 percent below the revised December estimate of $483.5 billion.
 Click on graph for larger image.
This graph shows private residential and nonresidential construction spending, and public spending, since 1993. Note: nominal dollars, not inflation adjusted.
Residential (red) spending is 7.1% below the recent peak.
Non-residential (blue) spending is slightly below the peak in the previous month.
Public construction spending is 0.9% below the peak last month.
 The second graph shows the year-over-year change in construction spending.
On a year-over-year basis, private residential construction spending is up 5.2%. Non-residential spending is up 15.2% year-over-year. Public spending is up 20.1% year-over-year.
This was below consensus expectations for 0.2% increase in spending, however, total construction spending for the previous two months was revised up.
ISM® Manufacturing index Decreased to 47.8% in February
by Calculated Risk on 3/01/2024 10:00:00 AM
(Posted with permission). The ISM manufacturing index indicated contraction. The PMI® was at 47.8% in February, down from 49.1% in January. The employment index was at 45.9%, down from 47.1% the previous month, and the new orders index was at 49.2%, down from 52.5%.
From ISM: Manufacturing PMI® at 47.8% February 2024 2024 Manufacturing ISM® Report On Business®
Economic activity in the manufacturing sector contracted in February for the 16th consecutive month following one month of “unchanged” status (a PMI® reading of 50 percent) and 28 months of growth prior to that, say the nation's supply executives in the latest Manufacturing ISM® Report On Business®.This suggests manufacturing contracted in February. This was below the consensus forecast.
The report was issued today by Timothy R. Fiore, CPSM, C.P.M., Chair of the Institute for Supply Management® (ISM®) Manufacturing Business Survey Committee:
“The Manufacturing PMI® registered 47.8 percent in February, down 1.3 percentage points from the 49.1 percent recorded in January. The overall economy continued in expansion for the 46th month after one month of contraction in April 2020. (A Manufacturing PMI® above 42.5 percent, over a period of time, generally indicates an expansion of the overall economy.) The New Orders Index moved back into contraction territory at 49.2 percent, 3.3 percentage points lower than the 52.5 percent recorded in January. The February reading of the Production Index (48.4 percent) is 2 percentage points lower than January’s figure of 50.4 percent. The Prices Index registered 52.5 percent, down 0.4 percentage point compared to the reading of 52.9 percent in January. The Backlog of Orders Index registered 46.3 percent, 1.6 percentage points higher than the 44.7 percent recorded in January. The Employment Index registered 45.9 percent, down 1.2 percentage points from January’s figure of 47.1 percent.
emphasis added
Thursday, February 29, 2024
Friday: ISM Mfg, Construction Spending, Vehicle Sales
by Calculated Risk on 2/29/2024 08:43:00 PM
 Note: Mortgage rates are from MortgageNewsDaily.com and are for top tier scenarios.
Friday:
• At 10:00 AM ET, ISM Manufacturing Index for February. The consensus is for the ISM to be at 49.2, up from 49.1 in January.
• At 10:00 AM, Construction Spending for January. The consensus is for a 0.2% increase in construction spending.
• At 10:00 AM, University of Michigan's Consumer sentiment index (Final for February).
• All day, Light vehicle sales for February. Sales were at 15.0 million in January (Seasonally Adjusted Annual Rate). The consensus is for sales of 15.5 million SAAR.
Freddie Mac House Price Index Increased in January; Up 6.2% Year-over-year
by Calculated Risk on 2/29/2024 04:40:00 PM
Today, in the Calculated Risk Real Estate Newsletter: Freddie Mac House Price Index Increased in January; Up 6.2% Year-over-year
A brief excerpt:
On a year-over-year basis, the National FMHPI was up 6.2% in January, from up 6.3% YoY in December. The YoY increase peaked at 19.1% in July 2021, and for this cycle, bottomed at up 0.9% YoY in April 2023. ...
As of January, 16 states were below their previous peaks, Seasonally Adjusted. The largest seasonally adjusted declines from the recent peak were in Idaho (-4.2%), Maine (-2.8%), Oregon (-1.8%), and Washington (-1.6%).
For cities (Core-based Statistical Areas, CBSA), here are the 30 cities with the largest declines from the peak, seasonally adjusted. Austin continues to be the worst performing city.

There is much more in the article.
Las Vegas January 2024: Visitor Traffic Up 3% YoY; Convention Traffic Up 9%
by Calculated Risk on 2/29/2024 02:32:00 PM
From the Las Vegas Visitor Authority: January 2024 Las Vegas Visitor Statistics
With a room inventory with roughly 4,300 more rooms than last year, est. visitor volume reached 3.38M, up 3.3% YoY.
Despite the larger room inventory vs. Jan 2023, overall hotel occupancy for the month was on par with last January at 78.9% (down ‐0.2 pts). Affected in part by the move of the CES tradeshow back to midweek dates this January instead of the weekend dates it spanned last January, Weekend occupancy for the month declined to 83.6% (down ‐4.8 pts) while Midweek occupancy increased to 77%, +1.8 pts YoY.
ADR for the month matched last January at approx. $191 while RevPAR saw a modest YoY decline to just under $151, ‐0.5%.
emphasis added
 Click on graph for larger image.
 The first graph shows visitor traffic for 2019 (Black), 2020 (dark blue), 2021 (light blue), 2022 (light orange), 2023 (dark orange) and 2024 (red).
Visitor traffic was up 3.3% compared to last January. Visitor traffic was down 0.8% compared to the same month in 2019.
The second graph shows convention traffic.

Convention traffic was up 8.6% compared to January 2023, and down 18.5% compared to January 2019. 
Note: There was almost no convention traffic from April 2020 through May 2021.
NAR: Pending Home Sales Decrease 4.9% in January; Down 8.8% Year-over-year
by Calculated Risk on 2/29/2024 10:00:00 AM
From the NAR: Pending Home Sales Receded 4.9% in January
Pending home sales in January dropped 4.9%, according to the National Association of REALTORS®. The Northeast and West posted monthly gains in transactions while the Midwest and South recorded losses. All four U.S. regions registered year-over-year decreases.This was well below expectations. Note: Contract signings usually lead sales by about 45 to 60 days, so this would usually be for closed sales in February and March.
The Pending Home Sales Index (PHSI)* – a forward-looking indicator of home sales based on contract signings – decreased to 74.3 in January. Year over year, pending transactions were down 8.8%. An index of 100 is equal to the level of contract activity in 2001.
...
The Northeast PHSI increased 0.8% from last month to 63.6, a decline of 5.5% from January 2023. The Midwest index decreased 7.6% to 73.7 in January, down 11.6% from one year ago.
The South PHSI declined 7.3% to 88.5 in January, falling 9.0% from the prior year. The West index rose 0.5% in January to 61.1, down 7.0% from January 2023.
emphasis added
PCE Measure of Shelter Slows to 6.1% YoY in January
by Calculated Risk on 2/29/2024 09:09:00 AM
Here is a graph of the year-over-year change in shelter from the CPI report and housing from the PCE report this morning, both through January 2024.
 CPI Shelter was up 6.1% year-over-year in January, down from 6.2% in December, and down from the cycle peak of 8.2% in March 2023.
Housing (PCE) was up 6.1% YoY in January, down from 6.3% in December, and down from the cycle peak of 8.3% in April 2023.
Since asking rents are mostly flat year-over-year, these measures will continue to slow over coming months.
Since asking rents are mostly flat year-over-year, these measures will continue to slow over coming months.
The second graph shows PCE prices, Core PCE prices and Core ex-housing over the last 6 months (annualized):
 Key measures are now close to the Fed's target on a 6-month basis.
PCE Price Index: 2.5%
Core PCE Prices: 2.5%
Core minus Housing: 1.8%
Personal Income increased 1.0% in January; Spending increased 0.2%
by Calculated Risk on 2/29/2024 08:35:00 AM
The BEA released the Personal Income and Outlays report for January:
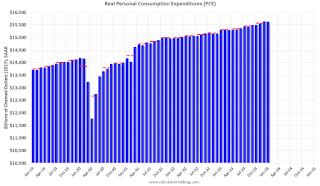
Personal income increased $233.7 billion (1.0 percent at a monthly rate) in January, according to estimates released today by the Bureau of Economic Analysis. Disposable personal income (DPI), personal income less personal current taxes, increased $67.6 billion (0.3 percent) and personal consumption expenditures (PCE) increased $43.9 billion (0.2 percent).The January PCE price index increased 2.4 percent year-over-year (YoY), down from 2.6 percent YoY in December, and down from the recent peak of 7.1 percent in June 2022.
The PCE price index increased 0.3 percent. Excluding food and energy, the PCE price index increased 0.4 percent. Real DPI decreased less than 0.1 percent in January and real PCE decreased 0.1 percent; goods decreased 1.1 percent and services increased 0.4 percent.
emphasis added
The PCE price index, excluding food and energy, increased 2.8 percent YoY, down from 2.9 percent in December, and down from the recent peak of 5.6 percent in February 2022.
The following graph shows real Personal Consumption Expenditures (PCE) through January 2024 (2017 dollars). Note that the y-axis doesn't start at zero to better show the change.
 Click on graph for larger image.
The dashed red lines are the quarterly levels for real PCE.
Personal income was above expectations and PCE was at expectations.
Inflation was slightly above expectations.
Weekly Initial Unemployment Claims Increase to 215,000
by Calculated Risk on 2/29/2024 08:30:00 AM
The DOL reported:
In the week ending February 24, the advance figure for seasonally adjusted initial claims was 215,000, an increase of 13,000 from the previous week's revised level. The previous week's level was revised up by 1,000 from 201,000 to 202,000. The 4-week moving average was 212,500, a decrease of 3,000 from the previous week's revised average. The previous week's average was revised up by 250 from 215,250 to 215,500.The following graph shows the 4-week moving average of weekly claims since 1971.
emphasis added
 Click on graph for larger image.
The dashed line on the graph is the current 4-week average. The four-week average of weekly unemployment claims decreased to 212,500.
The previous week was revised up.
Weekly claims were above the consensus forecast.


