by Calculated Risk on 3/04/2024 08:21:00 AM
Monday, March 04, 2024
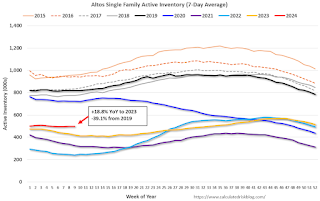
Housing March 4th Weekly Update: Inventory Up 0.1% Week-over-week, Up 18.8% Year-over-year
 Click on graph for larger image.
This inventory graph is courtesy of Altos Research.
Sunday, March 03, 2024
Sunday Night Futures
by Calculated Risk on 3/03/2024 06:14:00 PM
Weekend:
• Schedule for Week of March 3, 2024
Monday:
• No major economic releases scheduled.
From CNBC: Pre-Market Data and Bloomberg futures S&P 500 and DOW futures are down slightly (fair value).
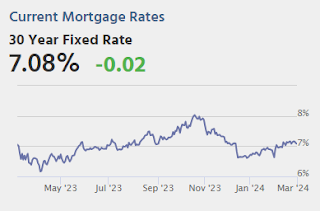
Oil prices were up over the last week with WTI futures at $79.97 per barrel and Brent at $83.55 per barrel. A year ago, WTI was at $80, and Brent was at $86 - so WTI oil prices are unchanged year-over-year.
Here is a graph from Gasbuddy.com for nationwide gasoline prices. Nationally prices are at $3.34 per gallon. A year ago, prices were at $3.36 per gallon, so gasoline prices are down $0.02 year-over-year.
Realtor.com Reports Active Inventory UP 17.8% YoY; New Listings up 11.9% YoY
by Calculated Risk on 3/03/2024 08:21:00 AM
What this means: On a weekly basis, Realtor.com reports the year-over-year change in active inventory and new listings. On a monthly basis, they report total inventory. For January, Realtor.com reported inventory was up 7.9% YoY, and down 40% compared to January 2019.
Realtor.com has monthly and weekly data on the existing home market. Here is their weekly report: Weekly Housing Trends View — Data Week Ending February 24, 2024
• Active inventory increased, with for-sale homes 17.8% above year ago levels. For a 16th straight week, active listings registered above prior year level, which means that today’s home shoppers see more for-sale homes. In fact, the January Realtor.com Housing Trends Report showed that 2024 had the most abundant level of inventory in the most recent four years. Nevertheless, the number of homes on the market is still down nearly 40% compared to what was typical in 2017 to 2019.
• New listings–a measure of sellers putting homes up for sale–were up this week, by 11.9% from one year ago. Newly listed homes bested year ago levels for an 18th week in a row. This may be even better news for home shoppers than the overall growth in active inventory because a jump in new listings means new options–vitally important for shoppers with a specific must-have list./blockquote>Here is a graph of the year-over-year change in inventory according to realtor.com.
Inventory was up year-over-year for the 16th consecutive week following 20 consecutive weeks with a YoY decrease in inventory.Inventory is still historically very low.Although new listings remain well below "typical pre-pandemic levels", new listings are now up YoY for the 18th consecutive week.
Saturday, March 02, 2024
Real Estate Newsletter Articles this Week: House Price Index Up 5.5% year-over-year in December
by Calculated Risk on 3/02/2024 02:11:00 PM
At the Calculated Risk Real Estate Newsletter this week:
• New Home Sales at 661,000 Annual Rate in January
• Case-Shiller: National House Price Index Up 5.5% year-over-year in December
• Freddie Reports Surge in Multifamily Serious Delinquencies
• Lawler: Update on American Homes for Rent (AMH)
• Freddie Mac House Price Index Increased in January; Up 6.2% Year-over-year
• Final Look at Local Housing Markets in January
This is usually published 4 to 6 times a week and provides more in-depth analysis of the housing market.
Schedule for Week of March 3, 2024
by Calculated Risk on 3/02/2024 08:11:00 AM
The key report scheduled for this week is the February employment report.
Fed Chair Powell presents the Semiannual Monetary Policy Report to the Congress on Wednesday and Thursday.
No major economic releases scheduled.
10:00 AM: the ISM Services Index for February.
7:00 AM ET: The Mortgage Bankers Association (MBA) will release the results for the mortgage purchase applications index.
8:15 AM: The ADP Employment Report for February. This report is for private payrolls only (no government). The consensus is for 150,000 payroll jobs added in February, up from 107,000 added in January.
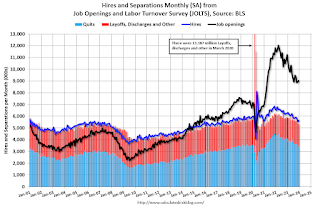 10:00 AM ET: Job Openings and Labor Turnover Survey for January from the BLS.
 This graph shows job openings (black line), hires (purple), Layoff, Discharges and other (red column), and Quits (light blue column) from the JOLTS.
Jobs openings increased in December to 9.03 million from 8.93 million in November.
10:00 AM: Testimony, Fed Chair Jerome Powell, Semiannual Monetary Policy Report to the Congress, Before the U.S. House Financial Services Committee
2:00 PM: the Federal Reserve Beige Book, an informal review by the Federal Reserve Banks of current economic conditions in their Districts.
8:30 AM: The initial weekly unemployment claims report will be released. The consensus is for 220 thousand initial claims, up from 216 thousand last week.
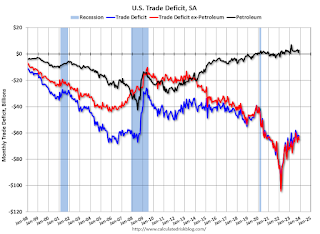 8:30 AM: Trade Balance report for January from the Census Bureau.
 This graph shows the U.S. trade deficit, with and without petroleum, through the most recent report. The blue line is the total deficit, and the black line is the petroleum deficit, and the red line is the trade deficit ex-petroleum products.
The consensus is the trade deficit to be $61.7 billion. The U.S. trade deficit was at $62.2 billion in December.
10:00 AM: Testimony, Fed Chair Jerome Powell, Semiannual Monetary Policy Report to the Congress, Before the U.S. Senate Committee on Banking, Housing, and Urban Affairs
12:00 PM: Q4 Flow of Funds Accounts of the United States from the Federal Reserve.
 8:30 AM: Employment Report for February. The consensus is for 188,000 jobs added, and for the unemployment rate to be unchanged at 3.7%.
There were 353,000 jobs added in January, and the unemployment rate was at 3.7%.
This graph shows the jobs added per month since January 2021.
Friday, March 01, 2024
March 1st COVID Update: Weekly Deaths Decreased
by Calculated Risk on 3/01/2024 08:00:00 PM
| COVID Metrics | ||||
|---|---|---|---|---|
| Now | Week Ago | Goal | ||
| Hospitalized2 | 15,458 | 16,863 | ≤3,0001 | |
| Deaths per Week2 | 1,318 | 2,001 | ≤3501 | |
| 1my goals to stop weekly posts, 2Weekly for Currently Hospitalized, and Deaths 🚩 Increasing number weekly for Hospitalized and Deaths ✅ Goal met. | ||||
 Click on graph for larger image.
This graph shows the weekly (columns) number of deaths reported.
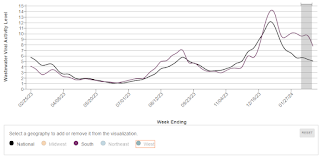 This appears to be a leading indicator for COVID hospitalizations and deaths.
Vehicles Sales Increase to 15.8 million SAAR in February; Up 6% YoY
by Calculated Risk on 3/01/2024 05:12:00 PM
Wards Auto released their estimate of light vehicle sales for January: U.S. Light-Vehicle Sales Bounce Back Nicely in February (pay site).
Inventory control was behind part of the month’s gains, but February evened out Januarys’s softness, which included payback for December’s strong results. The combined December-February seasonally adjusted annual rate of 15.7 million units is more indicative of current demand, despite the gyrations of the past three months.
 Click on graph for larger image.
This graph shows light vehicle sales since 2006 from the BEA (blue) and Wards Auto's estimate for February (red).
Sales in February (15.81 million SAAR) were up 5.4% from January, and up 6.3% from February 2023.
 Vehicle sales are usually a transmission mechanism for Federal Open Market Committee (FOMC) policy, although far behind housing. This time vehicle sales were more suppressed by supply chain issues and are up year-over-year.
Sales in February were above the consensus forecast.
GDP Tracking: Low 2% Range
by Calculated Risk on 3/01/2024 02:40:00 PM
From BofA:
This week, we align our 1Q GDP tracking with to our official forecast of 2.5% q/q saar. We still expect consumption growth to slow due to the negative impact from seasonal factors and extreme weather in January. But we have made upward revisions to the non-conconsumer sectors of the economy. [Mar 1st estimate]From Goldman:
emphasis added
We lowered our Q1 GDP tracking estimate by 0.2pp to +2.2% (qoq ar) and our Q1 domestic final sales forecast by 0.1pp to +2.5% (qoq ar), mainly reflecting weaker-than-expected residential construction spending. [Mar 1st estimate]And from the Altanta Fed: GDPNow
The GDPNow model estimate for real GDP growth (seasonally adjusted annual rate) in the first quarter of 2024 is 2.1 percent on March 1, down from 3.0 percent on February 29. After this morning’s construction spending release from the US Census Bureau and the Manufacturing ISM Report On Business from the Institute for Supply Management, the nowcasts of first-quarter real personal consumption expenditures growth and first-quarter real gross private domestic investment growth decreased from 3.0 percent and 3.0 percent, respectively, to 2.2 percent and 1.1 percent. [March 1st estimate]
Fannie and Freddie: Single Family Serious Delinquency Rate Decreases Slightly in January
by Calculated Risk on 3/01/2024 01:01:00 PM
Freddie Mac reported that the Single-Family serious delinquency rate in January was 0.55%, unchanged from 0.55% December. Freddie's rate is down year-over-year from 0.66% in January 2023. This is below the pre-pandemic lows. Freddie's serious delinquency rate peaked in February 2010 at 4.20% following the housing bubble and peaked at 3.17% in August 2020 during the pandemic.
Fannie Mae reported that the Single-Family Serious Delinquency decreased to 0.54% in January from 0.55% in December. The serious delinquency rate is down from 0.64% in January 2023. This is below the pre-pandemic lows. The Fannie Mae serious delinquency rate peaked in February 2010 at 5.59% following the housing bubble and peaked at 3.32% in August 2020 during the pandemic.

These are mortgage loans that are "three monthly payments or more past due or in foreclosure". Mortgages in forbearance are being counted as delinquent in this monthly report but are not reported to the credit bureaus.
For Fannie, by vintage, for loans made in 2004 or earlier (1% of portfolio), 1.62% are seriously delinquent (down from 1.67% the previous month).
For loans made in 2005 through 2008 (1% of portfolio), 2.44% are seriously delinquent (down from 2.53%).
For recent loans, originated in 2009 through 2023 (98% of portfolio), 0.47% are seriously delinquent (unchanged from 0.47%).
Construction Spending Decreased 0.2% in January
by Calculated Risk on 3/01/2024 10:15:00 AM
From the Census Bureau reported that overall construction spending increased:
Construction spending during January 2024 was estimated at a seasonally adjusted annual rate of $2,102.4 billion, 0.2 percent below the revised December estimate of $2,105.8 billion. The January figure is 11.7 percent above the January 2023 estimate of $1,882.2 billion.Private spending increased and public spending decreased:
emphasis added
Spending on private construction was at a seasonally adjusted annual rate of $1,623.4 billion, 0.1 percent above the revised December estimate of $1,622.3 billion. ...
In January, the estimated seasonally adjusted annual rate of public construction spending was $479.0 billion, 0.9 percent below the revised December estimate of $483.5 billion.
 Click on graph for larger image.
This graph shows private residential and nonresidential construction spending, and public spending, since 1993. Note: nominal dollars, not inflation adjusted.
Residential (red) spending is 7.1% below the recent peak.
Non-residential (blue) spending is slightly below the peak in the previous month.
Public construction spending is 0.9% below the peak last month.
 The second graph shows the year-over-year change in construction spending.
On a year-over-year basis, private residential construction spending is up 5.2%. Non-residential spending is up 15.2% year-over-year. Public spending is up 20.1% year-over-year.


