by Calculated Risk on 3/06/2024 07:00:00 AM
Wednesday, March 06, 2024
MBA: Mortgage Applications Increased in Weekly Survey
From the MBA: Mortgage Applications Increase in Latest MBA Weekly Survey
Mortgage applications increased 9.7 percent from one week earlier, according to data from the Mortgage Bankers Association’s (MBA) Weekly Mortgage Applications Survey for the week ending March 1, 2024.
The Market Composite Index, a measure of mortgage loan application volume, increased 9.7 percent on a seasonally adjusted basis from one week earlier. On an unadjusted basis, the Index increased 12 percent compared with the previous week. The Refinance Index increased 8 percent from the previous week and was 2 percent lower than the same week one year ago. The seasonally adjusted Purchase Index increased 11 percent from one week earlier. The unadjusted Purchase Index increased 13 percent compared with the previous week and was 8 percent lower than the same week one year ago.
"The latest data on inflation was not markedly better nor worse than expected, which was enough to bring mortgage rates down a bit, with the 30-year fixed mortgage rate declining slightly last week to 7.02 percent,” said Mike Fratantoni, MBA’s SVP and Chief Economist. “Mortgage applications were up considerably relative to the prior week, which included the President's Day holiday. Of note, purchase volume – particularly for FHA loans – was up strongly, again showing how sensitive the first-time homebuyer segment is to relatively small changes in the direction of rates. Other sources of housing data are showing increases in new listings, which is a real positive for the spring buying season given the lack of for-sale inventory."
...
The average contract interest rate for 30-year fixed-rate mortgages with conforming loan balances ($766,550 or less) decreased to 7.02 percent from 7.04 percent, with points unchanged at 0.67 (including the origination fee) for 80 percent loan-to-value ratio (LTV) loans.
emphasis added
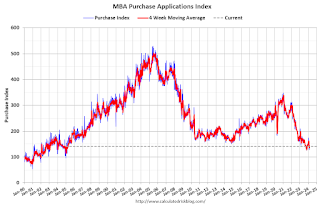
 Click on graph for larger image.
The first graph shows the MBA mortgage purchase index.
According to the MBA, purchase activity is down 8% year-over-year unadjusted.

Tuesday, March 05, 2024
Wednesday: Job Openings, Fed Chair Powell Testimony, Beige Book, ADP Employment
by Calculated Risk on 3/05/2024 07:49:00 PM

Wednesday:
• At 7:00 AM ET, The Mortgage Bankers Association (MBA) will release the results for the mortgage purchase applications index.
• At 8:15 AM, The ADP Employment Report for February. This report is for private payrolls only (no government). The consensus is for 150,000 payroll jobs added in February, up from 107,000 added in January.
• At 10:00 AM, Job Openings and Labor Turnover Survey for January from the BLS. Jobs openings increased in December to 9.03 million from 8.93 million in November.
• Also at 10:00 AM, Testimony, Fed Chair Jerome Powell, Semiannual Monetary Policy Report to the Congress, Before the U.S. House Financial Services Committee
• At 2:00 PM, the Federal Reserve Beige Book, an informal review by the Federal Reserve Banks of current economic conditions in their Districts.
Inflation Adjusted House Prices 2.4% Below Peak; Price-to-rent index is 7.3% below recent peak
by Calculated Risk on 3/05/2024 11:41:00 AM
Today, in the Calculated Risk Real Estate Newsletter: Inflation Adjusted House Prices 2.4% Below Peak
Excerpt:
It has been over 17 years since the bubble peak. In the December Case-Shiller house price index released last week, the seasonally adjusted National Index (SA), was reported as being 70% above the bubble peak in 2006. However, in real terms, the National index (SA) is about 10% above the bubble peak (and historically there has been an upward slope to real house prices). The composite 20, in real terms, is 1% above the bubble peak.
People usually graph nominal house prices, but it is also important to look at prices in real terms. As an example, if a house price was $300,000 in January 2010, the price would be $426,000 today adjusted for inflation (42% increase). That is why the second graph below is important - this shows "real" prices.
The third graph shows the price-to-rent ratio, and the fourth graph is the affordability index. The last graph shows the 5-year real return based on the Case-Shiller National Index.
...
The second graph shows the same two indexes in real terms (adjusted for inflation using CPI).
In real terms (using CPI), the National index is 2.4% below the recent peak, and the Composite 20 index is 3.2% below the recent peak in 2022. Both indexes declined slightly in December in real terms.
In real terms, national house prices are 10.2% above the bubble peak levels. There is an upward slope to real house prices, and it has been over 17 years since the previous peak, but real prices are historically high.
ISM® Services Index decreases to 52.6% in February
by Calculated Risk on 3/05/2024 10:00:00 AM
(Posted with permission). The ISM® Services index was at 52.6%, down from 53.4% last month. The employment index decreased to 48.0%, from 50.5%. Note: Above 50 indicates expansion, below 50 in contraction.
From the Institute for Supply Management: Services PMI® at 52.6% February 2024 Services ISM® Report On Business®
Economic activity in the services sector expanded in February for the 14th consecutive month as the Services PMI® registered 52.6 percent, say the nation's purchasing and supply executives in the latest Services ISM® Report On Business®. The sector has grown in 44 of the last 45 months, with the lone contraction in December 2022.The PMI was slightly below expectations.
The report was issued today by Anthony Nieves, CPSM, C.P.M., A.P.P., CFPM, Chair of the Institute for Supply Management® (ISM®) Services Business Survey Committee: “In February, the Services PMI® registered 52.6 percent, 0.8 percentage point lower than January’s reading of 53.4 percent. The composite index indicated growth in February for the 14th consecutive month after a reading of 49 percent in December 2022, which was the first contraction since May 2020 (45.4 percent). The Business Activity Index registered 57.2 percent in February, which is 1.4 percentage points higher than the 55.8 percent recorded in January. The New Orders Index expanded in February for the 14th consecutive month after contracting in December 2022 for the first time since May 2020; the figure of 56.1 percent is 1.1 percentage points higher than the January reading of 55 percent. The Employment Index contracted for the second time in three months with a reading of 48 percent, a 2.5-percentage point decrease compared to the 50.5 percent recorded in January.
emphasis added
CoreLogic: US Home Prices Increased 5.8% Year-over-year in January
by Calculated Risk on 3/05/2024 08:55:00 AM
Notes: This CoreLogic House Price Index report is for January. The recent Case-Shiller index release was for December. The CoreLogic HPI is a three-month weighted average and is not seasonally adjusted (NSA).
From CoreLogic: CoreLogic: Annual US Home Price Growth Moves Up Gradually Again in January
• U.S. single-family home prices (including distressed sales) increased by 5.8% year over year in January 2024 compared with January 2023. On a month-over-month basis, home prices increased by 0.1% compared with December 2023.
• In January, the annual appreciation of detached properties (6%) was 1.1 percentage points higher than that of attached properties (4.9%).
• CoreLogic’s forecast shows annual U.S. home price gains relaxing to 2.6% in January 2025.
• Miami posted the highest year-over-year home price increase of the country’s 10 highlighted metro areas in January, at 10.2%. San Diego saw the next-highest gain at 8.5%.
• Among states, Rhode Island ranked first for annual appreciation in January (up by 13.2%), followed by New Jersey (up by 11.6%) and Connecticut (up by 11%). No states recorded year-over-year home price losses.
...
“U.S. annual home price growth strengthened to 5.8% in January 2024,” said Dr. Selma Hepp, chief economist for CoreLogic. “And while the acceleration continues to reflect the residual impact of strong appreciation in early 2023, the annual rate of growth is expected to taper off in coming months.”
“Home prices further increased in late 2023 despite high mortgage rates, which surged to the highest level since the beginning of the millennium,” Hepp continued. “But metro areas that have struggled with the impact of higher rates continue to see downward movement on home prices. Generally, pressures from higher mortgage rates tend to occur in markets where the higher cost of homeownership pushes against the affordability ceiling.”
emphasis added
Monday, March 04, 2024
Tuesday: ISM Services
by Calculated Risk on 3/04/2024 08:54:00 PM

Mortgage rates were at the best levels in 2 weeks as of last Friday and today's offerings are only modestly higher.Tuesday:
...
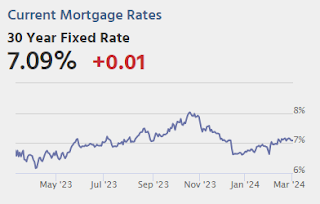
The two reports above all others are CPI (the Consumer Price Index) and the big jobs report. CPI caused a stir just before the sideways vibes set in and this Friday's jobs report is just as capable. [30 year fixed 7.09%]
emphasis added
• At 10:00 AM: the ISM Services Index for February.
Heavy Truck Sales Increased in February
by Calculated Risk on 3/04/2024 05:07:00 PM
This graph shows heavy truck sales since 1967 using data from the BEA. The dashed line is the February 2024 seasonally adjusted annual sales rate (SAAR).
Heavy truck sales really collapsed during the great recession, falling to a low of 180 thousand SAAR in May 2009. Then heavy truck sales increased to a new record high of 570 thousand SAAR in April 2019.
 Click on graph for larger image.
Note: "Heavy trucks - trucks more than 14,000 pounds gross vehicle weight."
Heavy truck sales declined sharply at the beginning of the pandemic, falling to a low of 308 thousand SAAR in May 2020.
Lawler: Some Thoughts on Quantitative Easing and Quantitative Tightening
by Calculated Risk on 3/04/2024 02:20:00 PM
Today, in the Real Estate Newsletter: Lawler: Some Thoughts on Quantitative Easing and Quantitative Tightening
Brief excerpt:
Now let’s look at MBS. Below is a table showing Agency MBS outstanding Agency MBS held by the public, and Agency MBS held by the private sector. (Again, the Fed holdings are as of the last Wednesday in December).There is much more in the article.
The Fed’s share of total Agency MBS outstanding hit a year-end high of 32% at the end of 2021 and was still above 27% at the end of last year. Again, Fed MBS purchases essentially involved taking longer-maturity fixed-rate MBS held by the public and “replacing” them with extremely short-term bank reserves/deposits at the Fed, thus reducing NOT the amount of government obligations held by the private sector, but significantly reducing the maturity/duration of government obligations held by the private sector.
Computing the impact of Fed MBS purchases on the maturity of government obligations held by the private sector is more challenging for MBS than for Treasuries, as the expected weighted average maturity/duration of MBS are heavily dependent on where interest rates are relative to the interest rates on the mortgages backing MBS.
ICE Mortgage Monitor: "First-Time Homebuyers Make Up Record 47% of GSE Purchase Loans"
by Calculated Risk on 3/04/2024 10:47:00 AM
Today, in the Real Estate Newsletter: ICE Mortgage Monitor: "First-Time Homebuyers Make Up Record 47% of GSE Purchase Loans"
Brief excerpt:
Press Release: ICE Mortgage Monitor: First-Time Homebuyers Make Up Record 47% of GSE Purchase Loans, 39% of All 2023 GSE Securitizations in 2023There is much more in the article.• Though originations hit a 30-year low in 2023, ICE eMBS data shows first-time homebuyers (FTHB) made up the highest share of agency purchase security issuance in at least 10 yearsA large share of GSE purchase loans in 2023 were for first-time homebuyers (FTHBs).
• First time homebuyers made up 55% of agency purchase mortgages in 2023 according to ICE eMBS data, the highest such share in the 10 years ICE has been tracking the metric
• Likewise, first-time homebuyers (FTHBs) accounted for a record 47% of GSE purchase loans in 2023, a number that’s been trending gradually higher throughout the past decade
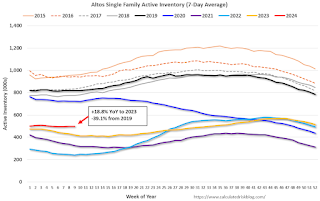
Housing March 4th Weekly Update: Inventory Up 0.1% Week-over-week, Up 18.8% Year-over-year
by Calculated Risk on 3/04/2024 08:21:00 AM
 Click on graph for larger image.
This inventory graph is courtesy of Altos Research.


