 RSS Feed
 by Calculated Risk on 3/07/2024 08:26:00 PM
Thursday, March 07, 2024
Friday: Employment Report
 Note: Mortgage rates are from MortgageNewsDaily.com and are for top tier scenarios.
Friday:
• At 8:30 AM ET,: Employment Report for February. The consensus is for 188,000 jobs added, and for the unemployment rate to be unchanged at 3.7%.
February Employment Preview
by Calculated Risk on 3/07/2024 05:16:00 PM
On Friday at 8:30 AM ET, the BLS will release the employment report for February. The consensus is for 188,000 jobs added, and for the unemployment rate to be unchanged at 3.7%.
There were 353,000 jobs added in January, and the unemployment rate was at 3.7%.
From Goldman Sachs economist Spencer Hill
We estimate nonfarm payrolls rose by 215k in February—somewhat above consensus of +200k but well below the +353k pace in January. We believe fewer end-of-year layoffs produced last month’s temporary spike, and with the seasonal layoff period now behind us, we assume a return towards a more normal pace of job gains. That said, our forecast also reflects a 30-50k weather boost from workers returning after the mid-January storms. ... We estimate that the unemployment rate was unchanged at 3.7%• ADP Report: The ADP employment report showed 140,000 private sector jobs were added in February. This suggests job gains slightly below consensus expectations, however, in general, ADP hasn't been very useful in forecasting the BLS report.
• ISM Surveys: Note that the ISM services are diffusion indexes based on the number of firms hiring (not the number of hires). The ISM® manufacturing employment index decreased in February to 45.9%, down from 47.1% last month. This would suggest about 40,000 jobs lost in manufacturing. The ADP report indicated 6,000 manufacturing jobs added in February.
The ISM® services employment index decreased to 48.0%, from 50.5%. This would suggest about 20,000 jobs added in the service sector. Combined this suggests job losses of 20,000 in February, far below consensus expectations.
• Unemployment Claims: The weekly claims report showed a larger number of initial unemployment claims during the reference week from 189,000 in January to 202,000 in February. This suggests slightly more layoffs in February compared to January.
• COVID: As far as the pandemic, the number of patients hospitalized during the reference week in February was around 17,000, down from 28,000 in January.
• Conclusion: Weather was favorable, but my guess is the headline number will be below consensus expectations.
The "Home ATM" Closed in Q4
by Calculated Risk on 3/07/2024 12:49:00 PM
Today, in the Real Estate Newsletter: The "Home ATM" Closed in Q4
Excerpt:
During the housing bubble, many homeowners borrowed heavily against their perceived home equity - jokingly calling it the “Home ATM” - and this contributed to the subsequent housing bust, since so many homeowners had negative equity in their homes when house prices declined. Note: Very few homeowners have negative equity now - unlike during the housing bubble.There is much more in the article. You can subscribe at https://calculatedrisk.substack.com/.
...
Here is the quarterly increase in mortgage debt from the Federal Reserve’s Financial Accounts of the United States - Z.1 (sometimes called the Flow of Funds report) released today. In the mid ‘00s, there was a large increase in mortgage debt associated with the housing bubble.
In Q4 2024, mortgage debt increased $90 billion, down from $119 billion in Q3, and down from the cycle peak of $467 billion in Q2 2021. Note the almost 7 years of declining mortgage debt as distressed sales (foreclosures and short sales) wiped out a significant amount of debt.
However, some of this debt is being used to increase the housing stock (purchase new homes), so this isn’t all Mortgage Equity Withdrawal (MEW).

Fed's Flow of Funds: Household Net Worth Increased $4.8 Trillion in Q4
by Calculated Risk on 3/07/2024 12:17:00 PM
The Federal Reserve released the Q4 2023 Flow of Funds report today: Financial Accounts of the United States.
The net worth of households and nonprofits rose to $156.2 trillion during the fourth quarter of 2023. The value of directly and indirectly held corporate equities increased $4.7 trillion and the value of real estate decreased $0.6 trillion.
...
Household debt increased 2.4 percent at an annual rate in the fourth quarter of 2023. Consumer credit grew at an annual rate of 3.3 percent, while mortgage debt (excluding charge-offs) grew at an annual rate of 2.1 percent.
 Click on graph for larger image.
The first graph shows Households and Nonprofit net worth as a percent of GDP.
Net worth increased $4.8 trillion in Q4 to an all-time high. As a percent of GDP, net worth increased in Q4, but is below the peak in 2021.
This includes real estate and financial assets (stocks, bonds, pension reserves, deposits, etc.) net of liabilities (mostly mortgages). Note that this does NOT include public debt obligations.
 The second graph shows homeowner percent equity since 1952.
Household percent equity (as measured by the Fed) collapsed when house prices fell sharply in 2007 and 2008.
In Q4 2023, household percent equity (of household real estate) was at 73.4% - down from 73.9% in Q3, 2023. This is close to the highest percent equity since the 1960s.
Note: This includes households with no mortgage debt.
 The third graph shows household real estate assets and mortgage debt as a percent of GDP.
Mortgage debt increased by $90 billion in Q4.
Mortgage debt is up $2.36 trillion from the peak during the housing bubble, but, as a percent of GDP is at 46.78% - down from Q3 - and down from a peak of 73.3% of GDP during the housing bust.
The value of real estate, as a percent of GDP, decreased in Q4 - and is below the peak in Q3 2022 - but is well above the average of the last 30 years.
 The second graph shows homeowner percent equity since 1952.
 Household percent equity (as measured by the Fed) collapsed when house prices fell sharply in 2007 and 2008.
In Q4 2023, household percent equity (of household real estate) was at 73.4% - down from 73.9% in Q3, 2023. This is close to the highest percent equity since the 1960s.
Note: This includes households with no mortgage debt.
 The third graph shows household real estate assets and mortgage debt as a percent of GDP.
 Mortgage debt increased by $90 billion in Q4.
Mortgage debt is up $2.36 trillion from the peak during the housing bubble, but, as a percent of GDP is at 46.78% - down from Q3 - and down from a peak of 73.3% of GDP during the housing bust.
The value of real estate, as a percent of GDP, decreased in Q4 - and is below the peak in Q3 2022 - but is well above the average of the last 30 years.
Wholesale Used Car Prices Declined in February; Down 13.1% Year-over-year
by Calculated Risk on 3/07/2024 09:23:00 AM
From Manheim Consulting today: Wholesale Used-Vehicle Prices Declined in February
Wholesale used-vehicle prices (on a mix, mileage, and seasonally adjusted basis) were down in February compared to January. The Manheim Used Vehicle Value Index (MUVVI) fell to 203.8, a decline of 13.1% from a year ago. The index was down 0.1% against the month of January 2024. The seasonal adjustment magnified February’s results. The non-adjusted price in February increased by 1.7% compared to January, moving the unadjusted average price down 11.0% year over year.
Though February activity was muted as we started the month, we saw more activity in the lanes at Manheim in the second half of the month and finished the last week of February with some of the strongest weekly gains in wholesale prices for many years,” said Jeremy Robb, senior director of Economic and Industry Insights for Cox Automotive. “Tax refunds have picked up over the last two weeks, with the average refund now 4% higher than 2023 levels at this time. This has put money into consumers’ pockets, and retail purchase activity is increasing. In turn, dealers are coming to the lanes and buying units at Manheim right at the start of the spring selling season for wholesale markets.”
emphasis added
 Click on graph for larger image.
This index from Manheim Consulting is based on all completed sales transactions at Manheim’s U.S. auctions.
The Manheim index suggests used car prices were unchanged in February (seasonally adjusted) and were down 13.1% year-over-year (YoY).
Trade Deficit at $67.4 Billion in January
by Calculated Risk on 3/07/2024 08:35:00 AM
The Census Bureau and the Bureau of Economic Analysis reported:
The U.S. Census Bureau and the U.S. Bureau of Economic Analysis announced today that the goods and services deficit was $67.4 billion in January, up $3.3 billion from $64.2 billion in December, revised.
January exports were $257.2 billion, $0.3 billion more than December exports. January imports were $324.6 billion, $3.6 billion more than December imports.
emphasis added
 Click on graph for larger image.
Both exports imports increased in January.
Exports are down 0.4% year-over-year; imports are down 1.2% year-over-year.
Both imports and exports decreased sharply due to COVID-19 and then bounced back - imports and exports are moving sideways recently.
The second graph shows the U.S. trade deficit, with and without petroleum.
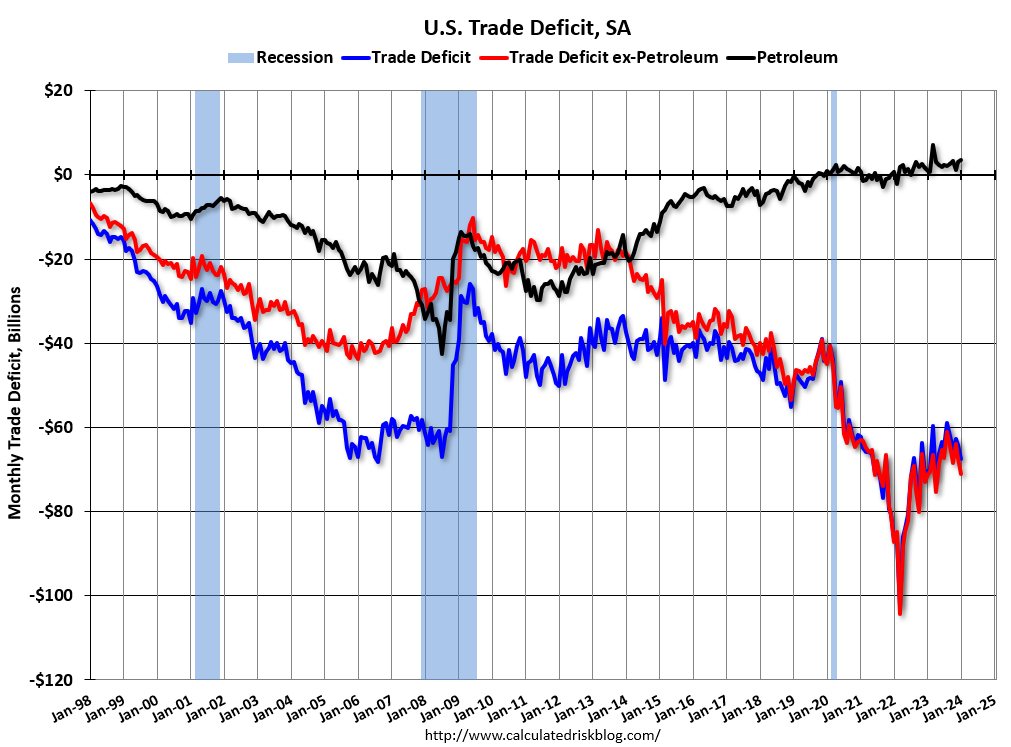 The blue line is the total deficit, and the black line is the petroleum deficit, and the red line is the trade deficit ex-petroleum products.
Note that net, exports of petroleum products are positive and have been increasing.
The trade deficit with China decreased to $23.7 billion from $25.2 billion a year ago.
Weekly Initial Unemployment Claims Increase to 217,000
by Calculated Risk on 3/07/2024 08:30:00 AM
The DOL reported:
In the week ending March 2, the advance figure for seasonally adjusted initial claims was 217,000, unchanged from the previous week's revised level. The previous week's level was revised up by 2,000 from 215,000 to 217,000. The 4-week moving average was 212,250, a decrease of 750 from the previous week's revised average. The previous week's average was revised up by 500 from 212,500 to 213,000.The following graph shows the 4-week moving average of weekly claims since 1971.
emphasis added
 Click on graph for larger image.
The dashed line on the graph is the current 4-week average. The four-week average of weekly unemployment claims decreased to 212,250.
The previous week was revised up.
Weekly claims were below the consensus forecast.
Wednesday, March 06, 2024
Thursday: Unemployment Claims, Trade Balance, Fed Chair Powell, Flow of Funds
by Calculated Risk on 3/06/2024 07:47:00 PM
 Note: Mortgage rates are from MortgageNewsDaily.com and are for top tier scenarios.
Thursday:
• At 8:30 AM ET, The initial weekly unemployment claims report will be released. The consensus is for 220 thousand initial claims, up from 216 thousand last week.
• At 8:30 AM, Trade Balance report for January from the Census Bureau. The consensus is the trade deficit to be $61.7 billion. The U.S. trade deficit was at $62.2 billion in December.
• At 10:00 AM, Testimony, Fed Chair Jerome Powell, Semiannual Monetary Policy Report to the Congress, Before the U.S. Senate Committee on Banking, Housing, and Urban Affairs
• At 12:00 PM, Q4 Flow of Funds Accounts of the United States from the Federal Reserve.
Fed's Beige Book: "Economic activity increased slightly"
by Calculated Risk on 3/06/2024 02:00:00 PM
Economic activity increased slightly, on balance, since early January, with eight Districts reporting slight to modest growth in activity, three others reporting no change, and one District noting a slight softening. Consumer spending, particularly on retail goods, inched down in recent weeks. Several reports cited heightened price sensitivity by consumers and noted that households continued to trade down and to shift spending away from discretionary goods. Activity in the leisure and hospitality sector varied by District and segment; while air travel was robust overall, demand for restaurants, hotels, and other establishments softened due to elevated prices, as well as to unusual weather conditions in certain regions. Manufacturing activity was largely unchanged, and supply bottlenecks normalized further. Nevertheless, delivery delays for electrical components continued. Ongoing shipping disruptions in the Red Sea and Panama Canal did not generally have a notable impact on businesses during the reporting period, although some contacts reported rising pressures on international shipping costs. Several reports highlighted a pickup in demand for residential real estate in recent weeks, largely owing to some moderation in mortgage rates, but noted that limited inventories hindered actual home sales. Commercial real estate activity was weak, particularly for office space, although there were reports of robust demand for new data centers, industrial and manufacturing spaces, and large infrastructure projects. Loan demand was stable to down, and credit quality was generally healthy despite a few reports of rising delinquencies. The outlook for future economic growth remained generally positive, with contacts noting expectations for stronger demand and less restrictive financial conditions over the next 6 to 12 months.
Labor Markets
Employment rose at a slight to modest pace in most Districts. Overall, labor market tightness eased further, with nearly all Districts highlighting some improvement in labor availability and employee retention. Businesses generally found it easier to fill open positions and to find qualified applicants, although difficulties persisted attracting workers for highly skilled positions, including health-care professionals, engineers, and skilled trades specialists such as welders and mechanics. Wages grew further across Districts, although several reports indicated a slower pace of increase. Employee expectations of pay adjustments were reportedly more in line with historical averages.
Prices
Price pressures persisted during the reporting period, but several Districts reported some degree of moderation in inflation. Contacts highlighted increases in freight costs and several insurance categories, including employer-sponsored health insurance. Nevertheless, businesses found it harder to pass through higher costs to their customers, who became increasingly sensitive to price changes. The cost of many manufacturing and construction inputs, such as steel, cement, paper, and fuel, reportedly fell in recent weeks.
emphasis added
Asking Rents Mostly Unchanged Year-over-year
by Calculated Risk on 3/06/2024 12:37:00 PM
Today, in the Real Estate Newsletter: Asking Rents Mostly Unchanged Year-over-year
Brief excerpt:
Here is a graph of the year-over-year (YoY) change for these measures since January 2015. Most of these measures are through January 2024, except CoreLogic is through December and Apartment List is through February 2024.There is much more in the article.
The CoreLogic measure is up 2.8% YoY in December, up from 2.7% in November, and down from a peak of 13.9% in April 2022.
The Zillow measure is up 3.4% YoY in January, mostly unchanged from 3.4% YoY in December, and down from a peak of 16.0% YoY in February 2022.
The ApartmentList measure is down 1.0% YoY as of February, mostly unchanged from -0.9% in January, and down from a peak of 18.2% YoY November 2021.
...
The YoY change in OER and in PCE housing have peaked, but will stay elevated for some time, even though asking rent growth has mostly flattened YoY.


