 RSS Feed
 by Calculated Risk on 3/11/2024 08:19:00 AM
Monday, March 11, 2024
Housing March 11th Weekly Update: Inventory Up 0.4% Week-over-week, Up 21.1% Year-over-year
Altos reports that active single-family inventory was up 0.4% week-over-week. It is likely inventory bottomed in mid-February, as opposed to mid-April in 2023, and inventory is now up 1.3% from the 2024 February bottom.
 Click on graph for larger image.
This inventory graph is courtesy of Altos Research.
As of March 8th, inventory was at 501 thousand (7-day average), compared to 498 thousand the prior week.
Inventory is still far below pre-pandemic levels.

The red line is for 2024. The black line is for 2019. Note that inventory is up more than double from the record low for the same week in 2022, but still well below normal levels.
Inventory was up 21.1% compared to the same week in 2023 (last week it was up 18.8%), and down 38.7% compared to the same week in 2019 (last week it was down 39.1%).
Back in June 2023, inventory was down almost 54% compared to 2019, so the gap to more normal inventory levels has closed a little.
Mike Simonsen discusses this data regularly on Youtube.
Sunday, March 10, 2024
Sunday Night Futures
by Calculated Risk on 3/10/2024 06:06:00 PM
Weekend:
• Schedule for Week of March 10, 2024
Monday:
• At 10:00 AM ET, State Employment and Unemployment (Monthly) for January 2024
From CNBC: Pre-Market Data and Bloomberg futures S&P 500 are up 8 and DOW futures are up 50 (fair value).
Oil prices were down over the last week with WTI futures at $78.01 per barrel and Brent at $82.08 per barrel. A year ago, WTI was at $77, and Brent was at $82 - so WTI oil prices are up slightly year-over-year.
Here is a graph from Gasbuddy.com for nationwide gasoline prices. Nationally prices are at $3.40 per gallon. A year ago, prices were at $3.44 per gallon, so gasoline prices are down $0.04 year-over-year.
Realtor.com Reports Active Inventory UP 19.9% YoY; New Listings up 17.4% YoY
by Calculated Risk on 3/10/2024 08:21:00 AM
What this means: On a weekly basis, Realtor.com reports the year-over-year change in active inventory and new listings. On a monthly basis, they report total inventory. For February, Realtor.com reported inventory was up 14.8% YoY, but still down almost 40% compared to February 2019.
Now - on a weekly basis - inventory is up 19.9% YoY, and that would still put inventory down about 38% compared to March 2019.
Realtor.com has monthly and weekly data on the existing home market. Here is their weekly report: Weekly Housing Trends View — Data Week Ending March 2, 2024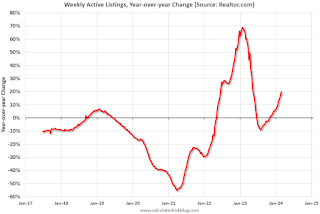 Here is a graph of the year-over-year change in inventory according to realtor.com.
Inventory was up year-over-year for the 17th consecutive week following 20 consecutive weeks with a YoY decrease in inventory.
Realtor.com has monthly and weekly data on the existing home market. Here is their weekly report: Weekly Housing Trends View — Data Week Ending March 2, 2024
• Active inventory increased, with for-sale homes 19.9% above year ago levels. For a 17th straight week, active listings registered above prior year level, which means that today’s home shoppers see more for-sale homes. In fact, the February Realtor.com Housing Trends Report showed that 2024 had the most abundant level of inventory since 2020, and inventory held relatively steady relative to January, counter to typical monthly trend over the last four years. Nevertheless, the number of homes on the market is still down nearly 40% compared to what was typical in 2017 to 2019.;
• New listings–a measure of sellers putting homes up for sale–were up this week, by 17.4% from one year ago. Newly listed homes reached above year ago levels for the 19th week in a row.
 Here is a graph of the year-over-year change in inventory according to realtor.com.
 Inventory was up year-over-year for the 17th consecutive week following 20 consecutive weeks with a YoY decrease in inventory.
Inventory is still historically very low.
Although new listings remain well below "typical pre-pandemic levels", new listings are now up YoY for the 19th consecutive week.
Saturday, March 09, 2024
Real Estate Newsletter Articles this Week: Price-to-rent index is 7.3% below recent peak
by Calculated Risk on 3/09/2024 02:11:00 PM
At the Calculated Risk Real Estate Newsletter this week:
• The "Home ATM" Closed in Q4
• Inflation Adjusted House Prices 2.4% Below Peak Price-to-rent index is 7.3% below recent peak
• Asking Rents Mostly Unchanged Year-over-year
• 1st Look at Local Housing Markets in February
• Lawler: Some Thoughts on Quantitative Easing and Quantitative Tightening
• ICE Mortgage Monitor: "First-Time Homebuyers Make Up Record 47% of GSE Purchase Loans"
This is usually published 4 to 6 times a week and provides more in-depth analysis of the housing market.
Schedule for Week of March 10, 2024
by Calculated Risk on 3/09/2024 08:11:00 AM
The key reports this week are February CPI and Retail Sales.
For manufacturing, the February Industrial Production report and the March NY Fed manufacturing survey will be released.
10:00 AM: State Employment and Unemployment (Monthly) for January 2024
6:00 AM ET: NFIB Small Business Optimism Index for February.
8:30 AM: The Consumer Price Index for February from the BLS. The consensus is for a 0.4% increase in CPI, and a 0.3% increase in core CPI. The consensus is for CPI to be up 3.1% Year-over-year (YoY), and core CPI to be up 3.7% YoY.
7:00 AM ET: The Mortgage Bankers Association (MBA) will release the results for the mortgage purchase applications index.
8:30 AM: The initial weekly unemployment claims report will be released. The consensus is for 221 thousand initial claims, up from 217 thousand last week.
 8:30 AM: Retail sales for February is scheduled to be released. The consensus is for a 0.7% increase in retail sales.
This graph shows retail sales since 1992. This is monthly retail sales and food service, seasonally adjusted (total and ex-gasoline).
8:30 AM: The Producer Price Index for February from the BLS. The consensus is for a 0.2% increase in PPI, and a 0.3% increase in core PPI.
8:30 AM: The New York Fed Empire State manufacturing survey for March. The consensus is for a reading of -8.0, down from -2.4.
 9:15 AM: The Fed will release Industrial Production and Capacity Utilization for February.
This graph shows industrial production since 1967.
The consensus is no changed in Industrial Production, and for Capacity Utilization to decrease to 78.4%.
10:00 AM: University of Michigan's Consumer sentiment index (Preliminary for March).
Friday, March 08, 2024
March 8th COVID Update: Weekly Deaths Decreased
by Calculated Risk on 3/08/2024 07:45:00 PM
 Note: Mortgage rates are from MortgageNewsDaily.com and are for top tier scenarios.
Due to changes at the CDC, weekly cases are no longer updated.
For deaths, I'm currently using 4 weeks ago for "now", since the most recent three weeks will be revised significantly.
Hospitalizations have declined significantly from the winter high of 30,020 earlier this year but are still well above the low of 5,380 last year.
| COVID Metrics | ||||
|---|---|---|---|---|
| Now | Week Ago | Goal | ||
| Hospitalized2 | 13,905 | 15,699 | ≤3,0001 | |
| Deaths per Week2 | 1,477 | 1,642 | ≤3501 | |
| 1my goals to stop weekly posts, 2Weekly for Currently Hospitalized, and Deaths 🚩 Increasing number weekly for Hospitalized and Deaths ✅ Goal met. | ||||
 Click on graph for larger image.
This graph shows the weekly (columns) number of deaths reported.
Weekly deaths have declined sharply from the recent peak of 2,521 but are still triple the low of 489 last year.
 This appears to be a leading indicator for COVID hospitalizations and deaths.
Nationally, COVID in wastewater is now off almost 70% from the holiday peak at the end of December, and that suggests weekly hospitalizations and deaths will continue to decline.
AAR: Rail Traffic Recovered in February
by Calculated Risk on 3/08/2024 03:12:00 PM
From the Association of American Railroads (AAR) Rail Time Indicators. Graphs and excerpts reprinted with permission.
U.S. rail traffic recovered in February after severe weather constrained volumes in January.
Total originated carloads on U.S. railroads averaged 221,387 per week in February, up from 205,034 in January. Total carloads were down 1.3% in February 2024 from February 2023. That’s a big improvement from January’s 7.2% decline.
...
Meanwhile, U.S. intermodal originations in February 2024 were up 10.9% over February 2023. That’s their biggest percentage gain in 32 months and the sixth straight gain of any size. Intermodal averaged 260,078 units per week in February 2024, the second most in 16 months.
emphasis added
 Click on graph for larger image.
This graph from the Rail Time Indicators report shows the six-week average of U.S. Carloads in 2022, 2023 and 2024:
In February, originated carloads on U.S. railroads were 885,548, down 1.3% (11,410 carloads) from last year. That’s a big improvement from January’s 7.2% decline. Carloads averaged 221,387 per week in February, up from 205,034 in January. Generally speaking, carload volumes remain constrained in part because the goods-side of the U.S. economy, including manufacturing as a whole (see pages 7 and 8), is not doing as well as it could be.
 The second graph shows the six-week average (not monthly) of U.S. intermodal in 2022, 2023 and 2024: (using intermodal or shipping containers):
U.S. intermodal originations in February 2024 totaled 1.04 million containers and trailers, up 10.9% (102,140 units) over February 2023. That’s the biggest year-over-year percentage gain for intermodal in 32 months and the sixth straight gain of any size. Intermodal averaged 260,078 units per week in February, up from 241,203 in January and the second most in 16 months.
GDP Tracking: Low 2% Range
by Calculated Risk on 3/08/2024 02:34:00 PM
From BofA:
Since our update last week, 1Q GDP tracking is down two-tenths to 2.3% q/q saar, and 4Q GDP tracking is up a tenth to 3.3% q/q saar from its second estimate print of 3.2% q/q saar. [Mar 8th estimate]From Goldman:
emphasis added
We left our Q1 GDP tracking estimate unchanged after rounding at +2.2% (qoq ar) and our Q1 domestic final sales forecast also unchanged at +2.5% (qoq ar). [Mar 6th estimate]And from the Altanta Fed: GDPNow
The GDPNow model estimate for real GDP growth (seasonally adjusted annual rate) in the first quarter of 2024 is 2.5 percent on March 7, unchanged from March 6. [March 7th estimate]
Comments on February Employment Report
by Calculated Risk on 3/08/2024 09:30:00 AM
The headline jobs number in the February employment report was above expectations; however, December and January payrolls were revised down by 167,000 combined. The participation rate was unchanged, the employment population ratio decreased, and the unemployment rate was increased to 3.9%.
Leisure and hospitality gained 58 thousand jobs in February. At the beginning of the pandemic, in March and April of 2020, leisure and hospitality lost 8.2 million jobs, and are now down 17 thousand jobs since February 2020. So, leisure and hospitality has now essentially added back all of the jobs lost in March and April 2020.
Construction employment increased 23 thousand and is now 547 thousand above the pre-pandemic level.
Manufacturing employment decreased 4 thousand jobs and is now 184 thousand above the pre-pandemic level.
Prime (25 to 54 Years Old) Participation
 Since the overall participation rate is impacted by both cyclical (recession) and demographic (aging population, younger people staying in school) reasons, here is the employment-population ratio for the key working age group: 25 to 54 years old.
The 25 to 54 years old participation rate increased in February to 83.5% from 83.3% in January, and the 25 to 54 employment population ratio increased to 80.7% from 80.6% the previous month.
Both are above pre-pandemic levels.
Average Hourly Wages
 The graph shows the nominal year-over-year change in "Average Hourly Earnings" for all private employees from the Current Employment Statistics (CES).
Average Hourly Wages
 The graph shows the nominal year-over-year change in "Average Hourly Earnings" for all private employees from the Current Employment Statistics (CES).
 There was a huge increase at the beginning of the pandemic as lower paid employees were let go, and then the pandemic related spike reversed a year later.
Wage growth has trended down after peaking at 5.9% YoY in March 2022 and was at 4.3% YoY in February.
Wage growth has trended down after peaking at 5.9% YoY in March 2022 and was at 4.3% YoY in February.
Part Time for Economic Reasons
 From the BLS report:
"The number of people employed part time for economic reasons, at 4.4 million, changed little in February. These individuals, who would have preferred full-time employment, were working part time because their hours had been reduced or they were unable to find full-time jobs."The number of persons working part time for economic reasons decreased in February to 4.36 million from 4.42 million in February. This is slightly above pre-pandemic levels.
These workers are included in the alternate measure of labor underutilization (U-6) that increased to 7.3% from 7.2% in the previous month. This is down from the record high in April 2020 of 23.0% and up from the lowest level on record (seasonally adjusted) in December 2022 (6.5%). (This series started in 1994). This measure is above the 7.0% level in February 2020 (pre-pandemic).
Unemployed over 26 Weeks
 This graph shows the number of workers unemployed for 27 weeks or more.
 According to the BLS, there are 1.203 million workers who have been unemployed for more than 26 weeks and still want a job, down from 1.277 million the previous month.
This is down from post-pandemic high of 4.174 million, and up from the recent low of 1.050 million.
This is close to pre-pandemic levels.
Job Streak
Summary:
The headline monthly jobs number was above consensus expectations; however, December and January payrolls were revised down by 167,000 combined. The participation rate was unchanged, the employment population ratio decreased, and the unemployment rate was increased to 3.9%. Another solid report.
This is close to pre-pandemic levels.
Job Streak
Through February 2024, the employment report indicated positive job growth for 38 consecutive months, putting the current streak in 5th place of the longest job streaks in US history (since 1939).
| Headline Jobs, Top 10 Streaks | ||
|---|---|---|
| Year Ended | Streak, Months | |
| 1 | 2019 | 100 |
| 2 | 1990 | 48 |
| 3 | 2007 | 46 |
| 4 | 1979 | 45 |
| 5 | 20241 | 38 |
| 6 tie | 1943 | 33 |
| 6 tie | 1986 | 33 |
| 6 tie | 2000 | 33 |
| 9 | 1967 | 29 |
| 10 | 1995 | 25 |
| 1Currrent Streak | ||
Summary:
The headline monthly jobs number was above consensus expectations; however, December and January payrolls were revised down by 167,000 combined. The participation rate was unchanged, the employment population ratio decreased, and the unemployment rate was increased to 3.9%. Another solid report.
February Employment Report: 275 thousand Jobs, 3.9% Unemployment Rate
by Calculated Risk on 3/08/2024 08:30:00 AM
From the BLS:
Total nonfarm payroll employment rose by 275,000 in February, and the unemployment rate increased to 3.9 percent, the U.S. Bureau of Labor Statistics reported today. Job gains occurred in health care, in government, in food services and drinking places, in social assistance, and in transportation and warehousing.
...
The change in total nonfarm payroll employment for December was revised down by 43,000, from +333,000 to +290,000, and the change for January was revised down by 124,000, from +353,000 to +229,000. With these revisions, employment in December and January combined is 167,000 lower than previously reported.
emphasis added
 Click on graph for larger image.
The first graph shows the jobs added per month since January 2021.
Total payrolls increased by 275 thousand in February. Private payrolls increased by 223 thousand, and public payrolls increased 52 thousand.
Payrolls for December and January were revised down 167 thousand, combined.
Payrolls for December and January were revised down 167 thousand, combined.
 The second graph shows the year-over-year change in total non-farm employment since 1968.
In February, the year-over-year change was 2.75 million jobs. Employment was up solidly year-over-year.
The third graph shows the employment population ratio and the participation rate.
 The Labor Force Participation Rate was unchanged at 62.5% in February, from 62.5% in January. This is the percentage of the working age population in the labor force.
 The Employment-Population ratio decreased to 60.1% from 60.2% (blue line).
I'll post the 25 to 54 age group employment-population ratio graph later.
 The fourth graph shows the unemployment rate.
 The unemployment rate increased to 3.9% in February from 3.7% in January.
This was well above consensus expectations; however, December and January payrolls were revised down by 167,000 combined.


