 RSS Feed
 by Calculated Risk on 3/12/2024 08:53:00 AM
Tuesday, March 12, 2024
YoY Measures of Inflation: Services, Goods and Shelter
Here are a few measures of inflation:
The first graph is the one Fed Chair Powell had mentioned when services less rent of shelter was up around 8% year-over-year. This declined and is now up 3.9% YoY (increased recently).
 Click on graph for larger image.
This graph shows the YoY price change for Services and Services less rent of shelter through February 2024.
Services were up 5.0% YoY as of February 2024, unchanged from 5.0% YoY in January.
Services less rent of shelter was up 3.9% YoY in February, up from 3.6% YoY in January.
Services less rent of shelter was up 3.9% YoY in February, up from 3.6% YoY in January.
 The second graph shows that goods prices started to increase year-over-year (YoY) in 2020 and accelerated in 2021 due to both strong demand and supply chain disruptions.
Durables were at -1.6% YoY as of February 2024, unchanged from -1.6% YoY in January.
Commodities less food and energy commodities were down 0.3% YoY in February, unchanged from down 0.3% YoY in January.
Commodities less food and energy commodities were down 0.3% YoY in February, unchanged from down 0.3% YoY in January.
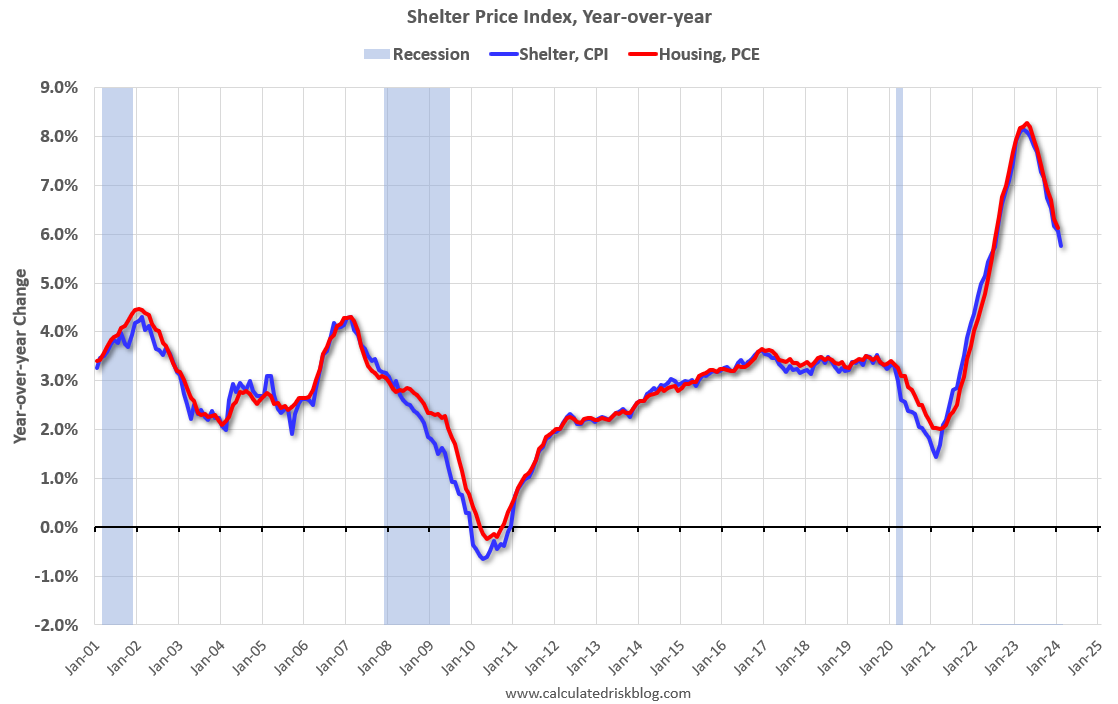 Here is a graph of the year-over-year change in shelter from the CPI report (through February) and housing from the PCE report (through January)
Shelter was up 5.8% year-over-year in February, down from 6.1% in January. Housing (PCE) was up 6.1% YoY in January, down from 6.3% in December.
This is still catching up with private data. The BLS noted this morning: "The index for shelter rose in February, as did the index for gasoline. Combined, these two indexes contributed over sixty percent of the monthly increase in the index for all items."
Core CPI ex-shelter was up 2.2% YoY in January, unchanged from 2.2% in February.
BLS: CPI Increased 0.4% in February; Core CPI increased 0.4%
by Calculated Risk on 3/12/2024 08:30:00 AM
The Consumer Price Index for All Urban Consumers (CPI-U) increased 0.4 percent in February on a seasonally adjusted basis, after rising 0.3 percent in January, the U.S. Bureau of Labor Statistics reported today. Over the last 12 months, the all items index increased 3.2 percent before seasonal adjustment.The change in both CPI and core CPI were slightly above expectations. I'll post a graph later today after the Cleveland Fed releases the median and trimmed-mean CPI.
The index for shelter rose in February, as did the index for gasoline. Combined, these two indexes contributed over sixty percent of the monthly increase in the index for all items. The energy index rose 2.3 percent over the month, as all of its component indexes increased. The food index was unchanged in February, as was the food at home index. The food away from home index rose 0.1 percent over the month.
The index for all items less food and energy rose 0.4 percent in February, as it did in January. Indexes which increased in February include shelter, airline fares, motor vehicle insurance, apparel, and recreation. The index for personal care and the index for household furnishings and operations were among those that decreased over the month.
The all items index rose 3.2 percent for the 12 months ending February, a larger increase than the 3.1-percent increase for the 12 months ending January. The all items less food and energy index rose 3.8 percent over the last 12 months. The energy index decreased 1.9 percent for the 12 months ending February, while the food index increased 2.2 percent over the last year.
emphasis added
Monday, March 11, 2024
Tuesday: CPI
by Calculated Risk on 3/11/2024 07:52:00 PM
 From Matthew Graham at Mortgage News Daily: Mortgage Rate Winning Streak Finally Pauses, But Just Barely
Mortgage rates hit their best levels in more than a month by the end of last week after moving lower for 4 straight days. If you could only know one thing about today, it's that although rates didn't extend their winning streak, they are still very close to Friday's levels--close enough that the typical borrower wouldn't care or notice.Tuesday:
...
[A]ll eyes are on CPI tomorrow. If it comes in much higher or lower than expected, rates will likely react in a major way. [30 year fixed 6.87%]
emphasis added
• At 6:00 AM ET, NFIB Small Business Optimism Index for February.
• At 8:30 AM, The Consumer Price Index for February from the BLS. The consensus is for a 0.4% increase in CPI, and a 0.3% increase in core CPI. The consensus is for CPI to be up 3.1% Year-over-year (YoY), and core CPI to be up 3.7% YoY.
Hotels: Occupancy Rate Decreased 0.3% Year-over-year
by Calculated Risk on 3/11/2024 02:13:00 PM
U.S. hotel performance was mostly positive year over year, according to CoStar’s latest data through 2 March.The following graph shows the seasonal pattern for the hotel occupancy rate using the four-week average.
25 February through 2 March 2024 (percentage change from comparable week in 2023):
• Occupancy: 62.5% (-0.3%)
• Average daily rate (ADR): US$155.29 (+2.7%)
• Revenue per available room (RevPAR): US$97.12 (+2.4%)
emphasis added
 Click on graph for larger image.
The red line is for 2024, black is 2020, blue is the median, and dashed light blue is for 2023. Dashed purple is for 2018, the record year for hotel occupancy.
The 4-week average of the occupancy rate is tracking below last year, and below the median rate for the period 2000 through 2023 (Blue).
Note: Y-axis doesn't start at zero to better show the seasonal change.
The 4-week average of the occupancy rate will increase seasonally over the next several weeks.
Lawler: Rent Trends at some Large Holders of Multifamily Properties
by Calculated Risk on 3/11/2024 11:19:00 AM
Today, in the Calculated Risk Real Estate Newsletter: Lawler: Rent Trends at some Large Holders of Multifamily Properties
A brief excerpt:
Below tables showing rent trends at three publicly traded companies owning large numbers of multifamily units – MAA, Equity Residential (EQR), and Avalon Bay Communities (AVB). ...There is much more in the article.
Not surprisingly, rent growth at all three companies has slowed sharply over the last year. Moreover, rent changes on new move-in’s slowed sharply beginning in the fourth quarter of last year, and were negative for all three companies last quarter.
Note also, however, that the YOY growth in rent renewals, while also down sharply from mid-2022, was still running in the 4 ½% - 5% range in January.

Housing March 11th Weekly Update: Inventory Up 0.4% Week-over-week, Up 21.1% Year-over-year
by Calculated Risk on 3/11/2024 08:19:00 AM
Altos reports that active single-family inventory was up 0.4% week-over-week. It is likely inventory bottomed in mid-February, as opposed to mid-April in 2023, and inventory is now up 1.3% from the 2024 February bottom.
 Click on graph for larger image.
This inventory graph is courtesy of Altos Research.
As of March 8th, inventory was at 501 thousand (7-day average), compared to 498 thousand the prior week.
Inventory is still far below pre-pandemic levels.

The red line is for 2024. The black line is for 2019. Note that inventory is up more than double from the record low for the same week in 2022, but still well below normal levels.
Inventory was up 21.1% compared to the same week in 2023 (last week it was up 18.8%), and down 38.7% compared to the same week in 2019 (last week it was down 39.1%).
Back in June 2023, inventory was down almost 54% compared to 2019, so the gap to more normal inventory levels has closed a little.
Mike Simonsen discusses this data regularly on Youtube.
Sunday, March 10, 2024
Sunday Night Futures
by Calculated Risk on 3/10/2024 06:06:00 PM
Weekend:
• Schedule for Week of March 10, 2024
Monday:
• At 10:00 AM ET, State Employment and Unemployment (Monthly) for January 2024
From CNBC: Pre-Market Data and Bloomberg futures S&P 500 are up 8 and DOW futures are up 50 (fair value).
Oil prices were down over the last week with WTI futures at $78.01 per barrel and Brent at $82.08 per barrel. A year ago, WTI was at $77, and Brent was at $82 - so WTI oil prices are up slightly year-over-year.
Here is a graph from Gasbuddy.com for nationwide gasoline prices. Nationally prices are at $3.40 per gallon. A year ago, prices were at $3.44 per gallon, so gasoline prices are down $0.04 year-over-year.
Realtor.com Reports Active Inventory UP 19.9% YoY; New Listings up 17.4% YoY
by Calculated Risk on 3/10/2024 08:21:00 AM
What this means: On a weekly basis, Realtor.com reports the year-over-year change in active inventory and new listings. On a monthly basis, they report total inventory. For February, Realtor.com reported inventory was up 14.8% YoY, but still down almost 40% compared to February 2019.
Now - on a weekly basis - inventory is up 19.9% YoY, and that would still put inventory down about 38% compared to March 2019.
Realtor.com has monthly and weekly data on the existing home market. Here is their weekly report: Weekly Housing Trends View — Data Week Ending March 2, 2024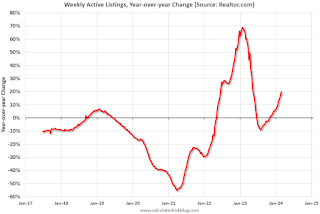 Here is a graph of the year-over-year change in inventory according to realtor.com.
Inventory was up year-over-year for the 17th consecutive week following 20 consecutive weeks with a YoY decrease in inventory.
Realtor.com has monthly and weekly data on the existing home market. Here is their weekly report: Weekly Housing Trends View — Data Week Ending March 2, 2024
• Active inventory increased, with for-sale homes 19.9% above year ago levels. For a 17th straight week, active listings registered above prior year level, which means that today’s home shoppers see more for-sale homes. In fact, the February Realtor.com Housing Trends Report showed that 2024 had the most abundant level of inventory since 2020, and inventory held relatively steady relative to January, counter to typical monthly trend over the last four years. Nevertheless, the number of homes on the market is still down nearly 40% compared to what was typical in 2017 to 2019.;
• New listings–a measure of sellers putting homes up for sale–were up this week, by 17.4% from one year ago. Newly listed homes reached above year ago levels for the 19th week in a row.
 Here is a graph of the year-over-year change in inventory according to realtor.com.
 Inventory was up year-over-year for the 17th consecutive week following 20 consecutive weeks with a YoY decrease in inventory.
Inventory is still historically very low.
Although new listings remain well below "typical pre-pandemic levels", new listings are now up YoY for the 19th consecutive week.
Saturday, March 09, 2024
Real Estate Newsletter Articles this Week: Price-to-rent index is 7.3% below recent peak
by Calculated Risk on 3/09/2024 02:11:00 PM
At the Calculated Risk Real Estate Newsletter this week:
• The "Home ATM" Closed in Q4
• Inflation Adjusted House Prices 2.4% Below Peak Price-to-rent index is 7.3% below recent peak
• Asking Rents Mostly Unchanged Year-over-year
• 1st Look at Local Housing Markets in February
• Lawler: Some Thoughts on Quantitative Easing and Quantitative Tightening
• ICE Mortgage Monitor: "First-Time Homebuyers Make Up Record 47% of GSE Purchase Loans"
This is usually published 4 to 6 times a week and provides more in-depth analysis of the housing market.
Schedule for Week of March 10, 2024
by Calculated Risk on 3/09/2024 08:11:00 AM
The key reports this week are February CPI and Retail Sales.
For manufacturing, the February Industrial Production report and the March NY Fed manufacturing survey will be released.
10:00 AM: State Employment and Unemployment (Monthly) for January 2024
6:00 AM ET: NFIB Small Business Optimism Index for February.
8:30 AM: The Consumer Price Index for February from the BLS. The consensus is for a 0.4% increase in CPI, and a 0.3% increase in core CPI. The consensus is for CPI to be up 3.1% Year-over-year (YoY), and core CPI to be up 3.7% YoY.
7:00 AM ET: The Mortgage Bankers Association (MBA) will release the results for the mortgage purchase applications index.
8:30 AM: The initial weekly unemployment claims report will be released. The consensus is for 221 thousand initial claims, up from 217 thousand last week.
 8:30 AM: Retail sales for February is scheduled to be released. The consensus is for a 0.7% increase in retail sales.
This graph shows retail sales since 1992. This is monthly retail sales and food service, seasonally adjusted (total and ex-gasoline).
8:30 AM: The Producer Price Index for February from the BLS. The consensus is for a 0.2% increase in PPI, and a 0.3% increase in core PPI.
8:30 AM: The New York Fed Empire State manufacturing survey for March. The consensus is for a reading of -8.0, down from -2.4.
 9:15 AM: The Fed will release Industrial Production and Capacity Utilization for February.
This graph shows industrial production since 1967.
The consensus is no changed in Industrial Production, and for Capacity Utilization to decrease to 78.4%.
10:00 AM: University of Michigan's Consumer sentiment index (Preliminary for March).


