 RSS Feed
 by Calculated Risk on 3/13/2024 07:00:00 AM
Wednesday, March 13, 2024
MBA: Mortgage Applications Increased in Weekly Survey
From the MBA: Mortgage Applications Increase in Latest MBA Weekly Survey
Mortgage applications increased 7.1 percent from one week earlier, according to data from the Mortgage Bankers Association’s (MBA) Weekly Mortgage Applications Survey for the week ending March 8, 2024.
The Market Composite Index, a measure of mortgage loan application volume, increased 7.1 percent on a seasonally adjusted basis from one week earlier. On an unadjusted basis, the Index increased 8 percent compared with the previous week. The Refinance Index increased 12 percent from the previous week and was 5 percent higher than the same week one year ago. The seasonally adjusted Purchase Index increased 5 percent from one week earlier. The unadjusted Purchase Index increased 6 percent compared with the previous week and was 11 percent lower than the same week one year ago.
“Mortgage rates dropped below 7 percent last week for most loan types because of incoming economic data showing a weaker service sector and a less robust job market, with an increase in the unemployment rate and downward revisions to job growth in prior months,” said Mike Fratantoni, MBA’s SVP and Chief Economist. “Purchase application volume increased for the week but remains about 11 percent below last year’s level. By contrast, refinance volume picked up by 12 percent, with a larger, 24 percent increase in the government refinance index. While these percentage increases are large, the level of refinance activity remains quite low, and we expect that most of this activity reflects borrowers who took out a loan at or near the peak of rates in the past two years.”
...
The average contract interest rate for 30-year fixed-rate mortgages with conforming loan balances ($766,550 or less) decreased to 6.84 percent from 7.02 percent, with points decreasing to 0.65 from 0.67 (including the origination fee) for 80 percent loan-to-value ratio (LTV) loans.
emphasis added
 Click on graph for larger image.
The first graph shows the MBA mortgage purchase index.
According to the MBA, purchase activity is down 11% year-over-year unadjusted.
Red is a four-week average (blue is weekly).
Purchase application activity is up slightly from the lows in late October 2023, and below the lowest levels during the housing bust.

The second graph shows the refinance index since 1990.
With higher mortgage rates, the refinance index declined sharply in 2022, and has mostly flatlined since then.
Tuesday, March 12, 2024
Wednesday: Mortgage Applications
by Calculated Risk on 3/12/2024 08:10:00 PM
 Note: Mortgage rates are from MortgageNewsDaily.com and are for top tier scenarios.
Wednesday:
• At 7:00 AM ET, The Mortgage Bankers Association (MBA) will release the results for the mortgage purchase applications index.
Favorable Weather Boosted Employment by About 100,000 in February
by Calculated Risk on 3/12/2024 03:27:00 PM
The BLS reported 275 thousand non-farm jobs were added in February. During the Winter months, I like to look at the weather impact on the report.
The BLS reported 243 thousand people were employed in non-agriculture industries, with a job, but not at work due to bad weather. The average for February over the previous 10 years was 368 thousand (median 272 thousand), so fewer people than normal were impacted by bad weather.
The BLS also reported 633 thousand people that are usually full-time employees were working part time in February due to bad weather. The average for February over the previous 10 years was 1.55 million (the median was 694 thousand). This series suggests weather positively impacted employment more than usual.
The San Francisco Fed estimates Weather-Adjusted Change in Total Nonfarm Employment (monthly change, seasonally adjusted). They use local area weather to estimate the impact on employment. For February, the San Francisco Fed estimated that weather boosted employment by about 100 thousand jobs.
2nd Look at Local Housing Markets in February; Inventory Continues to Surge in Florida
by Calculated Risk on 3/12/2024 12:47:00 PM
Today, in the Calculated Risk Real Estate Newsletter: 2nd Look at Local Housing Markets in February
A brief excerpt:
NOTE: The tables for active listings, new listings and closed sales all include a comparison to February 2019 for each local market (some 2019 data is not available).There is much more in the article.
This is the second look at several local markets in February. I’m tracking about 40 local housing markets in the US. Some of the 40 markets are states, and some are metropolitan areas. I’ll update these tables throughout the month as additional data is released.
Closed sales in February were mostly for contracts signed in December and January when 30-year mortgage rates averaged 6.82% and 6.64%, respectively. This is down from the 7%+ mortgage rates in the August through November period.
...
Here is a summary of active listings for these early reporting housing markets in February.
Inventory for these markets were up 12.4% year-over-year in January and are now up 23.8% year-over-year. A key will be if inventory builds over the next few months. Yesterday, Mike Simonson, President of Altos Research wrote: “The market could peak at 40% inventory growth over last year.”
Special Note: Florida is overweighted in this early sample, and that has distorted the overall picture (since inventory is surging in Florida).
Inventory is down in most of these areas compared to 2019.
...
Many more local markets to come!

Cleveland Fed: Median CPI increased 0.4% and Trimmed-mean CPI increased 0.3% in February
by Calculated Risk on 3/12/2024 11:15:00 AM
The Cleveland Fed released the median CPI and the trimmed-mean CPI.
According to the Federal Reserve Bank of Cleveland, the median Consumer Price Index rose 0.4% in February. The 16% trimmed-mean Consumer Price Index increased 0.3%. "The median CPI and 16% trimmed-mean CPI are measures of core inflation calculated by the Federal Reserve Bank of Cleveland based on data released in the Bureau of Labor Statistics’ (BLS) monthly CPI report".
 Click on graph for larger image.
This graph shows the year-over-year change for these four key measures of inflation.
Note: The Cleveland Fed released the median CPI details. The volatile "Motor fuel" increased at a 54% annual rate in February.
According to the Federal Reserve Bank of Cleveland, the median Consumer Price Index rose 0.4% in February. The 16% trimmed-mean Consumer Price Index increased 0.3%. "The median CPI and 16% trimmed-mean CPI are measures of core inflation calculated by the Federal Reserve Bank of Cleveland based on data released in the Bureau of Labor Statistics’ (BLS) monthly CPI report".
 Click on graph for larger image.
This graph shows the year-over-year change for these four key measures of inflation.
On a year-over-year basis, the median CPI rose 4.6% (down from 4.9% in January), the trimmed-mean CPI rose 3.5% (down from 3.7%), and the CPI less food and energy rose 3.8% (down from 3.9%).
Core PCE is for January was up 2.8% YoY, down from 2.9% in December.
Note: The Cleveland Fed released the median CPI details. The volatile "Motor fuel" increased at a 54% annual rate in February.
Rent and Owner's equivalent rent are still very high, and if we exclude rent, median CPI would be around 1.8% year-over-year.
YoY Measures of Inflation: Services, Goods and Shelter
by Calculated Risk on 3/12/2024 08:53:00 AM
Here are a few measures of inflation:
The first graph is the one Fed Chair Powell had mentioned when services less rent of shelter was up around 8% year-over-year. This declined and is now up 3.9% YoY (increased recently).
 Click on graph for larger image.
This graph shows the YoY price change for Services and Services less rent of shelter through February 2024.
Services were up 5.0% YoY as of February 2024, unchanged from 5.0% YoY in January.
Services less rent of shelter was up 3.9% YoY in February, up from 3.6% YoY in January.
Services less rent of shelter was up 3.9% YoY in February, up from 3.6% YoY in January.
 The second graph shows that goods prices started to increase year-over-year (YoY) in 2020 and accelerated in 2021 due to both strong demand and supply chain disruptions.
Durables were at -1.6% YoY as of February 2024, unchanged from -1.6% YoY in January.
Commodities less food and energy commodities were down 0.3% YoY in February, unchanged from down 0.3% YoY in January.
Commodities less food and energy commodities were down 0.3% YoY in February, unchanged from down 0.3% YoY in January.
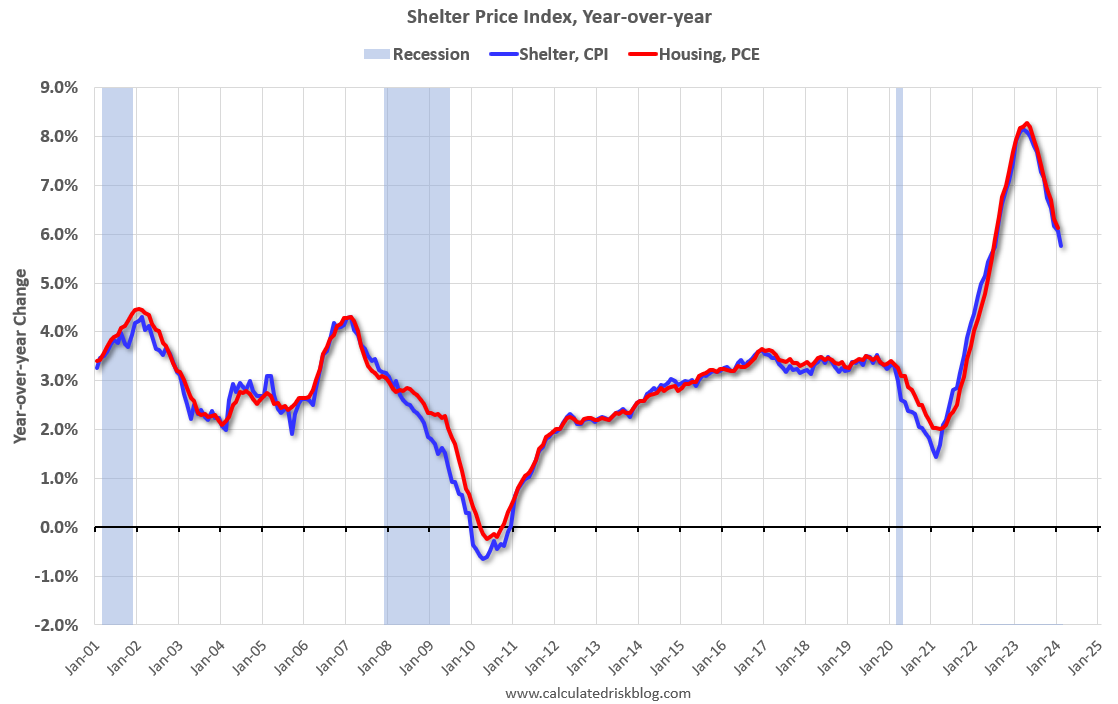 Here is a graph of the year-over-year change in shelter from the CPI report (through February) and housing from the PCE report (through January)
Shelter was up 5.8% year-over-year in February, down from 6.1% in January. Housing (PCE) was up 6.1% YoY in January, down from 6.3% in December.
This is still catching up with private data. The BLS noted this morning: "The index for shelter rose in February, as did the index for gasoline. Combined, these two indexes contributed over sixty percent of the monthly increase in the index for all items."
Core CPI ex-shelter was up 2.2% YoY in January, unchanged from 2.2% in February.
BLS: CPI Increased 0.4% in February; Core CPI increased 0.4%
by Calculated Risk on 3/12/2024 08:30:00 AM
The Consumer Price Index for All Urban Consumers (CPI-U) increased 0.4 percent in February on a seasonally adjusted basis, after rising 0.3 percent in January, the U.S. Bureau of Labor Statistics reported today. Over the last 12 months, the all items index increased 3.2 percent before seasonal adjustment.The change in both CPI and core CPI were slightly above expectations. I'll post a graph later today after the Cleveland Fed releases the median and trimmed-mean CPI.
The index for shelter rose in February, as did the index for gasoline. Combined, these two indexes contributed over sixty percent of the monthly increase in the index for all items. The energy index rose 2.3 percent over the month, as all of its component indexes increased. The food index was unchanged in February, as was the food at home index. The food away from home index rose 0.1 percent over the month.
The index for all items less food and energy rose 0.4 percent in February, as it did in January. Indexes which increased in February include shelter, airline fares, motor vehicle insurance, apparel, and recreation. The index for personal care and the index for household furnishings and operations were among those that decreased over the month.
The all items index rose 3.2 percent for the 12 months ending February, a larger increase than the 3.1-percent increase for the 12 months ending January. The all items less food and energy index rose 3.8 percent over the last 12 months. The energy index decreased 1.9 percent for the 12 months ending February, while the food index increased 2.2 percent over the last year.
emphasis added
Monday, March 11, 2024
Tuesday: CPI
by Calculated Risk on 3/11/2024 07:52:00 PM
 From Matthew Graham at Mortgage News Daily: Mortgage Rate Winning Streak Finally Pauses, But Just Barely
Mortgage rates hit their best levels in more than a month by the end of last week after moving lower for 4 straight days. If you could only know one thing about today, it's that although rates didn't extend their winning streak, they are still very close to Friday's levels--close enough that the typical borrower wouldn't care or notice.Tuesday:
...
[A]ll eyes are on CPI tomorrow. If it comes in much higher or lower than expected, rates will likely react in a major way. [30 year fixed 6.87%]
emphasis added
• At 6:00 AM ET, NFIB Small Business Optimism Index for February.
• At 8:30 AM, The Consumer Price Index for February from the BLS. The consensus is for a 0.4% increase in CPI, and a 0.3% increase in core CPI. The consensus is for CPI to be up 3.1% Year-over-year (YoY), and core CPI to be up 3.7% YoY.
Hotels: Occupancy Rate Decreased 0.3% Year-over-year
by Calculated Risk on 3/11/2024 02:13:00 PM
U.S. hotel performance was mostly positive year over year, according to CoStar’s latest data through 2 March.The following graph shows the seasonal pattern for the hotel occupancy rate using the four-week average.
25 February through 2 March 2024 (percentage change from comparable week in 2023):
• Occupancy: 62.5% (-0.3%)
• Average daily rate (ADR): US$155.29 (+2.7%)
• Revenue per available room (RevPAR): US$97.12 (+2.4%)
emphasis added
 Click on graph for larger image.
The red line is for 2024, black is 2020, blue is the median, and dashed light blue is for 2023. Dashed purple is for 2018, the record year for hotel occupancy.
The 4-week average of the occupancy rate is tracking below last year, and below the median rate for the period 2000 through 2023 (Blue).
Note: Y-axis doesn't start at zero to better show the seasonal change.
The 4-week average of the occupancy rate will increase seasonally over the next several weeks.
Lawler: Rent Trends at some Large Holders of Multifamily Properties
by Calculated Risk on 3/11/2024 11:19:00 AM
Today, in the Calculated Risk Real Estate Newsletter: Lawler: Rent Trends at some Large Holders of Multifamily Properties
A brief excerpt:
Below tables showing rent trends at three publicly traded companies owning large numbers of multifamily units – MAA, Equity Residential (EQR), and Avalon Bay Communities (AVB). ...There is much more in the article.
Not surprisingly, rent growth at all three companies has slowed sharply over the last year. Moreover, rent changes on new move-in’s slowed sharply beginning in the fourth quarter of last year, and were negative for all three companies last quarter.
Note also, however, that the YOY growth in rent renewals, while also down sharply from mid-2022, was still running in the 4 ½% - 5% range in January.


