 RSS Feed
 by Calculated Risk on 3/14/2024 02:21:00 PM
Thursday, March 14, 2024
Realtor.com Reports Active Inventory UP 21.7% YoY; New Listings up 15.8% YoY
What this means: On a weekly basis, Realtor.com reports the year-over-year change in active inventory and new listings. On a monthly basis, they report total inventory. For February, Realtor.com reported inventory was up 14.8% YoY, but still down almost 40% compared to February 2019.
Now - on a weekly basis - inventory is up 21.7% YoY.
Realtor.com has monthly and weekly data on the existing home market. Here is their weekly report: Weekly Housing Trends View—Data Week Ending March 9, 2024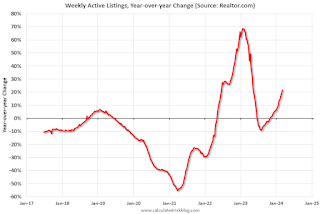 Here is a graph of the year-over-year change in inventory according to realtor.com.
Inventory was up year-over-year for the 18th consecutive week following 20 consecutive weeks with a YoY decrease in inventory.
Realtor.com has monthly and weekly data on the existing home market. Here is their weekly report: Weekly Housing Trends View—Data Week Ending March 9, 2024
• Active inventory increased, with for-sale homes 21.7% above year-ago levels. For an 18th straight week, active listings registered above the prior-year level, which means that today’s home shoppers see more for-sale homes. In fact, the February Realtor.com Housing Trends Report showed that 2024 had the most abundant level of inventory since 2020, and inventory held relatively steady relative to January, counter to the typical monthly trend over the past four years. Nevertheless, the number of homes on the market is still down nearly 40% compared with what was typical in 2017 to 2019.
• New listings–a measure of sellers putting homes up for sale–were up this week, by 15.8% from one year ago. For the 20th consecutive week, newly listed homes have surpassed levels from a year ago.
 Here is a graph of the year-over-year change in inventory according to realtor.com.
 Inventory was up year-over-year for the 18th consecutive week following 20 consecutive weeks with a YoY decrease in inventory.
Inventory is still historically very low.
Although new listings remain below "typical pre-pandemic levels", new listings are now up YoY for the 20th consecutive week.
Part 2: Current State of the Housing Market; Overview for mid-March 2024
by Calculated Risk on 3/14/2024 11:10:00 AM
Today, in the Calculated Risk Real Estate Newsletter: Part 2: Current State of the Housing Market; Overview for mid-March 2024
A brief excerpt:
Yesterday, in Part 1: Current State of the Housing Market; Overview for mid-March 2024 I reviewed home inventory, housing starts and sales.There is much more in the article.
In Part 2, I will look at house prices, mortgage rates, rents and more - and review the house price outlook for 2024.
...
Other measures of house prices suggest prices will be up a little further YoY in the January Case-Shiller index. The NAR reported median prices were up 5.1% YoY in January, up from 4.1% YoY in December. ICE reported prices were up 5.6% YoY in January, and Freddie Mac reported house prices were up 6.2% YoY in January, down from 6.3% YoY in December.
Here is a comparison of year-over-year change in the FMHPI, median house prices from the NAR, and the Case-Shiller National index.
The FMHPI and the NAR median prices appear to be leading indicators for Case-Shiller. Based on recent monthly data, and the FMHPI, the YoY change in the Case-Shiller index will likely increase a little further in the report for January.

Retail Sales Increased 0.6% in February
by Calculated Risk on 3/14/2024 08:35:00 AM
On a monthly basis, retail sales were up 0.6% from January to February (seasonally adjusted), and sales were up 1.5 percent from February 2023.
From the Census Bureau report:
Advance estimates of U.S. retail and food services sales for February 2024, adjusted for seasonal variation and holiday and trading-day differences, but not for price changes, were $700.7 billion, up 0.6 percent from the previous month, and up 1.5 percent above February 2023. ... The December 2023 to January 2024 percent change was revised from down 0.8 percent to down 1.1 percent.
emphasis added
 Click on graph for larger image.
This graph shows retail sales since 1992. This is monthly retail sales and food service, seasonally adjusted (total and ex-gasoline).
Retail sales ex-gasoline were up 0.6% in February.
The second graph shows the year-over-year change in retail sales and food service (ex-gasoline) since 1993.
Retail and Food service sales, ex-gasoline, increased by 2.0% on a YoY basis.
 The increase in sales in February was above expectations, however, sales in December and January were revised down.
Weekly Initial Unemployment Claims Decrease to 209,000
by Calculated Risk on 3/14/2024 08:30:00 AM
The DOL reported:
In the week ending March 9, the advance figure for seasonally adjusted initial claims was 209,000, a decrease of 1,000 from the previous week's revised level. The previous week's level was revised down by 7,000 from 217,000 to 210,000. The 4-week moving average was 208,000, a decrease of 500 from the previous week's revised average. The previous week's average was revised down by 3,750 from 212,250 to 208,500.The following graph shows the 4-week moving average of weekly claims since 1971.
emphasis added
 Click on graph for larger image.
The dashed line on the graph is the current 4-week average. The four-week average of weekly unemployment claims decreased to 208,000.
The previous week was revised down.
Weekly claims were below the consensus forecast.
Wednesday, March 13, 2024
Thursday: Retail Sales, Unemployment Claims, PPI
by Calculated Risk on 3/13/2024 08:03:00 PM
 Note: Mortgage rates are from MortgageNewsDaily.com and are for top tier scenarios.
Thursday:
• At 8:30 AM ET, The initial weekly unemployment claims report will be released. The consensus is for 221 thousand initial claims, up from 217 thousand last week.
• At 8:30 AM, Retail sales for February is scheduled to be released. The consensus is for a 0.7% increase in retail sales.
• At 8:30 AM, The Producer Price Index for February from the BLS. The consensus is for a 0.2% increase in PPI, and a 0.3% increase in core PPI.
Part 1: Current State of the Housing Market; Overview for mid-March 2024
by Calculated Risk on 3/13/2024 02:46:00 PM
Today, in the Calculated Risk Real Estate Newsletter: Part 1: Current State of the Housing Market; Overview for mid-March 2024
A brief excerpt:
This 2-part overview for mid-March provides a snapshot of the current housing market.There is much more in the article.
I always like to start with inventory, since inventory usually tells the tale!
...
Here is a graph of new listing from Realtor.com’s February 2024 Monthly Housing Market Trends Report showing new listings were up 11.3% year-over-year in February. This is still well below pre-pandemic levels. From Realtor.com:
However, providing a boost to overall inventory, sellers turned out in higher numbers this February as newly listed homes were 11.3% above last year’s levels. This marked the fourth month of increasing listing activity after a 17-month streak of decline.Note the seasonality for new listings. December and January are seasonally the weakest months of the year for new listings, followed by February and November. New listings will be up year-over-year in 2024, but we will have to wait for the March and April data to see how close new listings are to normal levels.
There are always people that need to sell due to the so-called 3 D’s: Death, Divorce, and Disease. Also, in certain times, some homeowners will need to sell due to unemployment or excessive debt (neither is much of an issue right now).
And there are homeowners who want to sell for a number of reasons: upsizing (more babies), downsizing, moving for a new job, or moving to a nicer home or location (move-up buyers). It is some of the “want to sell” group that has been locked in with the golden handcuffs over the last couple of years, since it is financially difficult to move when your current mortgage rate is around 3%, and your new mortgage rate will be in the 6 1/2% to 7% range.
But time is a factor for this “want to sell” group, and eventually some of them will take the plunge. That is probably why we are seeing more new listings now.

Q4 Update: Delinquencies, Foreclosures and REO
by Calculated Risk on 3/13/2024 09:40:00 AM
Today, in the Calculated Risk Real Estate Newsletter: Q4 Update: Delinquencies, Foreclosures and REO
A brief excerpt:
I’ve argued repeatedly that we would NOT see a surge in foreclosures that would significantly impact house prices (as happened following the housing bubble). The two key reasons are mortgage lending has been solid, and most homeowners have substantial equity in their homes..There is much more in the article. You can subscribe at https://calculatedrisk.substack.com/
...
And on mortgage rates, here is some data from the FHFA’s National Mortgage Database showing the distribution of interest rates on closed-end, fixed-rate 1-4 family mortgages outstanding at the end of each quarter since Q1 2013 through Q3 2023 (Q4 2023 data will be released in a two weeks).
This shows the surge in the percent of loans under 3%, and also under 4%, starting in early 2020 as mortgage rates declined sharply during the pandemic. Currently 22.6% of loans are under 3%, 59.4% are under 4%, and 78.7% are under 5%.
With substantial equity, and low mortgage rates (mostly at a fixed rates), few homeowners will have financial difficulties.

MBA: Mortgage Applications Increased in Weekly Survey
by Calculated Risk on 3/13/2024 07:00:00 AM
From the MBA: Mortgage Applications Increase in Latest MBA Weekly Survey
Mortgage applications increased 7.1 percent from one week earlier, according to data from the Mortgage Bankers Association’s (MBA) Weekly Mortgage Applications Survey for the week ending March 8, 2024.
The Market Composite Index, a measure of mortgage loan application volume, increased 7.1 percent on a seasonally adjusted basis from one week earlier. On an unadjusted basis, the Index increased 8 percent compared with the previous week. The Refinance Index increased 12 percent from the previous week and was 5 percent higher than the same week one year ago. The seasonally adjusted Purchase Index increased 5 percent from one week earlier. The unadjusted Purchase Index increased 6 percent compared with the previous week and was 11 percent lower than the same week one year ago.
“Mortgage rates dropped below 7 percent last week for most loan types because of incoming economic data showing a weaker service sector and a less robust job market, with an increase in the unemployment rate and downward revisions to job growth in prior months,” said Mike Fratantoni, MBA’s SVP and Chief Economist. “Purchase application volume increased for the week but remains about 11 percent below last year’s level. By contrast, refinance volume picked up by 12 percent, with a larger, 24 percent increase in the government refinance index. While these percentage increases are large, the level of refinance activity remains quite low, and we expect that most of this activity reflects borrowers who took out a loan at or near the peak of rates in the past two years.”
...
The average contract interest rate for 30-year fixed-rate mortgages with conforming loan balances ($766,550 or less) decreased to 6.84 percent from 7.02 percent, with points decreasing to 0.65 from 0.67 (including the origination fee) for 80 percent loan-to-value ratio (LTV) loans.
emphasis added
 Click on graph for larger image.
The first graph shows the MBA mortgage purchase index.
According to the MBA, purchase activity is down 11% year-over-year unadjusted.
Red is a four-week average (blue is weekly).
Purchase application activity is up slightly from the lows in late October 2023, and below the lowest levels during the housing bust.

The second graph shows the refinance index since 1990.
With higher mortgage rates, the refinance index declined sharply in 2022, and has mostly flatlined since then.
Tuesday, March 12, 2024
Wednesday: Mortgage Applications
by Calculated Risk on 3/12/2024 08:10:00 PM
 Note: Mortgage rates are from MortgageNewsDaily.com and are for top tier scenarios.
Wednesday:
• At 7:00 AM ET, The Mortgage Bankers Association (MBA) will release the results for the mortgage purchase applications index.
Favorable Weather Boosted Employment by About 100,000 in February
by Calculated Risk on 3/12/2024 03:27:00 PM
The BLS reported 275 thousand non-farm jobs were added in February. During the Winter months, I like to look at the weather impact on the report.
The BLS reported 243 thousand people were employed in non-agriculture industries, with a job, but not at work due to bad weather. The average for February over the previous 10 years was 368 thousand (median 272 thousand), so fewer people than normal were impacted by bad weather.
The BLS also reported 633 thousand people that are usually full-time employees were working part time in February due to bad weather. The average for February over the previous 10 years was 1.55 million (the median was 694 thousand). This series suggests weather positively impacted employment more than usual.
The San Francisco Fed estimates Weather-Adjusted Change in Total Nonfarm Employment (monthly change, seasonally adjusted). They use local area weather to estimate the impact on employment. For February, the San Francisco Fed estimated that weather boosted employment by about 100 thousand jobs.


