 RSS Feed
 by Calculated Risk on 3/16/2024 02:11:00 PM
Saturday, March 16, 2024
Real Estate Newsletter Articles this Week: Current State of the Housing Market
At the Calculated Risk Real Estate Newsletter this week:
• Part 1: Current State of the Housing Market; Overview for mid-March 2024
• Part 2: Current State of the Housing Market; Overview for mid-March 2024
• Q4 Update: Delinquencies, Foreclosures and REO
• 3rd Look at Local Housing Markets in February
• Lawler: Rent Trends at some Large Holders of Multifamily Properties
• 2nd Look at Local Housing Markets in February
This is usually published 4 to 6 times a week and provides more in-depth analysis of the housing market.
Schedule for Week of March 17, 2024
by Calculated Risk on 3/16/2024 08:11:00 AM
The key reports this week are February Housing Starts and Existing Home Sales.
The FOMC meets this week, and no change to policy is expected.
10:00 AM: The March NAHB homebuilder survey. The consensus is for a reading of 48, unchanged from 48. Any number below 50 indicates that more builders view sales conditions as poor than good.
 8:30 AM: Housing Starts for February.
 This graph shows single and multi-family housing starts since 1968.
The consensus is for 1.435 million SAAR, up from 1.331 million SAAR.
7:00 AM ET: The Mortgage Bankers Association (MBA) will release the results for the mortgage purchase applications index.
During the day: The AIA's Architecture Billings Index for February (a leading indicator for commercial real estate).
2:00 PM: FOMC Meeting Announcement. No change to policy is expected at this meeting.
2:00 PM: FOMC Projections. This will include the Federal Open Market Committee (FOMC) participants' projections of the appropriate target federal funds rate along with updated economic projections.
2:30 PM: Fed Chair Jerome Powell holds a press briefing following the FOMC announcement.
8:30 AM: The initial weekly unemployment claims report will be released. The consensus is for 212 thousand initial claims, up from 209 thousand last week.
8:30 AM: the Philly Fed manufacturing survey for March. The consensus is for a reading of -2.5, down from 5.2.
 10:00 AM: Existing Home Sales for February from the National Association of Realtors (NAR). The consensus is for 3.94 million SAAR, down from 4.00 million.
The graph shows existing home sales from 1994 through the report last month.
Housing economist Tom Lawler expects the NAR to report sales of 4.40 million SAAR for February (well above consensus).
----- Friday, March 22nd -----
10:00 AM: State Employment and Unemployment (Monthly) for February 2024
10:00 AM: State Employment and Unemployment (Monthly) for February 2024
Friday, March 15, 2024
March 15th COVID Update: Weekly Deaths Decreased
by Calculated Risk on 3/15/2024 07:46:00 PM
 Note: Mortgage rates are from MortgageNewsDaily.com and are for top tier scenarios.
Due to changes at the CDC, weekly cases are no longer updated.
For deaths, I'm currently using 4 weeks ago for "now", since the most recent three weeks will be revised significantly.
Hospitalizations have declined significantly from the winter high of 30,023 earlier this year but are still more than double the low of 5,380 last year.
| COVID Metrics | ||||
|---|---|---|---|---|
| Now | Week Ago | Goal | ||
| Hospitalized2 | 12,259 | 14,270 | ≤3,0001 | |
| Deaths per Week2 | 1,259 | 1,518 | ≤3501 | |
| 1my goals to stop weekly posts, 2Weekly for Currently Hospitalized, and Deaths 🚩 Increasing number weekly for Hospitalized and Deaths ✅ Goal met. | ||||
 Click on graph for larger image.
This graph shows the weekly (columns) number of deaths reported.
Weekly deaths have declined sharply from the recent peak of 2,528 but are still more than double the low of 489 last July.
 This appears to be a leading indicator for COVID hospitalizations and deaths.
Nationally, COVID in wastewater is now off more than 75% from the holiday peak at the end of December, and that suggests weekly hospitalizations and deaths will continue to decline.
Lawler: Early Read on Existing Home Sales in February
by Calculated Risk on 3/15/2024 04:15:00 PM
From housing economist Tom Lawler:
Based on publicly-available local realtor/MLS reports released across the country through today, I project that existing home sales as estimated by the National Association of Realtors ran at a seasonally adjusted annual rate of 4.40 million in February, up 10% from January’s preliminary pace but down 2.9% from last February’s seasonally adjusted pace. Unadjusted sales should show a small YOY gain, with the SA/NSA difference reflecting the higher business day count this February compared with last February.
Local realtor/MLS reports suggest that the median existing single-family home sales price last month was up by about 6.5% from last February.
CR Note: The National Association of Realtors (NAR) is scheduled to release February existing home sales on Thursday, March 21st, at 10:00 AM ET. The consensus is for 3.94 million SAAR.
3rd Look at Local Housing Markets in February
by Calculated Risk on 3/15/2024 01:44:00 PM
Today, in the Calculated Risk Real Estate Newsletter: 3rd Look at Local Housing Markets in February
A brief excerpt:
NOTE: The tables for active listings, new listings and closed sales all include a comparison to February 2019 for each local market (some 2019 data is not available).There is much more in the article.
This is the third look at several local markets in February. I’m tracking about 40 local housing markets in the US. Some of the 40 markets are states, and some are metropolitan areas. I’ll update these tables throughout the month as additional data is released.
Closed sales in February were mostly for contracts signed in December and January when 30-year mortgage rates averaged 6.82% and 6.64%, respectively. This is down from the 7%+ mortgage rates in the August through November period.
...
In February, sales in these markets were up 1.4% YoY. In January, these same markets were up 2.4% year-over-year Not Seasonally Adjusted (NSA).
Sales in most of these markets are down compared to January 2019.
...
More local markets to come!

GDP Tracking: Around 2%
by Calculated Risk on 3/15/2024 11:31:00 AM
From BofA:
Since our update last week, 1Q GDP tracking is up one-tenth to 2.4% q/q saar; 4Q tracking is up three-tenths to 3.6% q/q saar. [Mar 15th estimate]From Goldman:
emphasis added
We lowered our Q1 GDP tracking estimate by 0.1pp to +1.6% (qoq ar) and our Q1 domestic final sales forecast by 0.2pp to +2.0% (qoq ar), mainly reflecting the normalization of utilities output in February. [Mar 15th estimate]And from the Altanta Fed: GDPNow
The GDPNow model estimate for real GDP growth (seasonally adjusted annual rate) in the first quarter of 2024 is 2.3 percent on March 14, down from 2.5 percent from March 7. After recent releases from the US Department of the Treasury's Bureau of the Fiscal Service, the US Bureau of Labor Statistics, and the US Census Bureau, a decrease in the nowcast of first-quarter real personal consumption expenditures growth from 2.9 percent to 2.2 percent was slightly offset by increases in the nowcasts of first-quarter real gross private domestic investment growth and first-quarter real government spending growth from 1.7 and 2.4 percent, respectively, to 3.0 and 2.7 percent. [March 14th estimate]
Industrial Production Increased 0.1% in February
by Calculated Risk on 3/15/2024 09:15:00 AM
From the Fed: Industrial Production and Capacity Utilization
Industrial production edged up 0.1 percent in February after declining 0.5 percent in January. In February, the output of manufacturing rose 0.8 percent and the index for mining climbed 2.2 percent. Both gains partly reflected recoveries from weather-related declines in January. The index for utilities fell 7.5 percent in February because of warmer-than-typical temperatures. At 102.3 percent of its 2017 average, total industrial production in February was 0.2 percent below its year-earlier level. Capacity utilization for the industrial sector remained at 78.3 percent in February, a rate that is 1.3 percentage points below its long-run (1972–2023) average.
emphasis added
 Click on graph for larger image.
This graph shows Capacity Utilization. This series is up from the record low set in April 2020, and above the level in February 2020 (pre-pandemic).
Capacity utilization at 78.3% is 1.3% below the average from 1972 to 2022. This was below consensus expectations.
Note: y-axis doesn't start at zero to better show the change.
 The second graph shows industrial production since 1967.
Industrial production increased to 102.3. This is above the pre-pandemic level.
Industrial production was above consensus expectations.
Thursday, March 14, 2024
Friday: NY Fed Mfg, Industrial Production
by Calculated Risk on 3/14/2024 08:01:00 PM
 Note: Mortgage rates are from MortgageNewsDaily.com and are for top tier scenarios.
Friday:
• At 8:30 AM ET, The New York Fed Empire State manufacturing survey for March. The consensus is for a reading of -8.0, down from -2.4.
• At 9:15 AM, The Fed will release Industrial Production and Capacity Utilization for February. The consensus is no changed in Industrial Production, and for Capacity Utilization to decrease to 78.4%.
• At 10:00 AM, University of Michigan's Consumer sentiment index (Preliminary for March).
Realtor.com Reports Active Inventory UP 21.7% YoY; New Listings up 15.8% YoY
by Calculated Risk on 3/14/2024 02:21:00 PM
What this means: On a weekly basis, Realtor.com reports the year-over-year change in active inventory and new listings. On a monthly basis, they report total inventory. For February, Realtor.com reported inventory was up 14.8% YoY, but still down almost 40% compared to February 2019.
Now - on a weekly basis - inventory is up 21.7% YoY.
Realtor.com has monthly and weekly data on the existing home market. Here is their weekly report: Weekly Housing Trends View—Data Week Ending March 9, 2024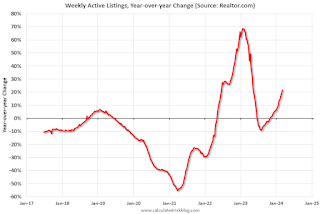 Here is a graph of the year-over-year change in inventory according to realtor.com.
Inventory was up year-over-year for the 18th consecutive week following 20 consecutive weeks with a YoY decrease in inventory.
Realtor.com has monthly and weekly data on the existing home market. Here is their weekly report: Weekly Housing Trends View—Data Week Ending March 9, 2024
• Active inventory increased, with for-sale homes 21.7% above year-ago levels. For an 18th straight week, active listings registered above the prior-year level, which means that today’s home shoppers see more for-sale homes. In fact, the February Realtor.com Housing Trends Report showed that 2024 had the most abundant level of inventory since 2020, and inventory held relatively steady relative to January, counter to the typical monthly trend over the past four years. Nevertheless, the number of homes on the market is still down nearly 40% compared with what was typical in 2017 to 2019.
• New listings–a measure of sellers putting homes up for sale–were up this week, by 15.8% from one year ago. For the 20th consecutive week, newly listed homes have surpassed levels from a year ago.
 Here is a graph of the year-over-year change in inventory according to realtor.com.
 Inventory was up year-over-year for the 18th consecutive week following 20 consecutive weeks with a YoY decrease in inventory.
Inventory is still historically very low.
Although new listings remain below "typical pre-pandemic levels", new listings are now up YoY for the 20th consecutive week.
Part 2: Current State of the Housing Market; Overview for mid-March 2024
by Calculated Risk on 3/14/2024 11:10:00 AM
Today, in the Calculated Risk Real Estate Newsletter: Part 2: Current State of the Housing Market; Overview for mid-March 2024
A brief excerpt:
Yesterday, in Part 1: Current State of the Housing Market; Overview for mid-March 2024 I reviewed home inventory, housing starts and sales.There is much more in the article.
In Part 2, I will look at house prices, mortgage rates, rents and more - and review the house price outlook for 2024.
...
Other measures of house prices suggest prices will be up a little further YoY in the January Case-Shiller index. The NAR reported median prices were up 5.1% YoY in January, up from 4.1% YoY in December. ICE reported prices were up 5.6% YoY in January, and Freddie Mac reported house prices were up 6.2% YoY in January, down from 6.3% YoY in December.
Here is a comparison of year-over-year change in the FMHPI, median house prices from the NAR, and the Case-Shiller National index.
The FMHPI and the NAR median prices appear to be leading indicators for Case-Shiller. Based on recent monthly data, and the FMHPI, the YoY change in the Case-Shiller index will likely increase a little further in the report for January.


