 RSS Feed
 by Calculated Risk on 3/18/2024 01:51:00 PM
Monday, March 18, 2024
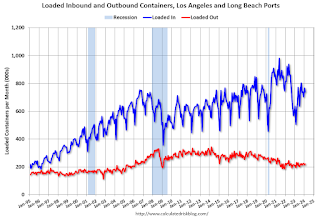
LA Port Traffic Increased Sharply Year-over-year in February
Container traffic gives us an idea about the volume of goods being exported and imported - and usually some hints about the trade report since LA area ports handle about 40% of the nation's container port traffic.
The following graphs are for inbound and outbound traffic at the ports of Los Angeles and Long Beach in TEUs (TEUs: 20-foot equivalent units or 20-foot-long cargo container).
To remove the strong seasonal component for inbound traffic, the first graph shows the rolling 12-month average.
 Click on graph for larger image.
On a rolling 12-month basis, inbound traffic increased 2.8% in February compared to the rolling 12 months ending in January. Outbound traffic increased 1.0% compared to the rolling 12 months ending the previous month.
The 2nd graph is the monthly data (with a strong seasonal pattern for imports).
 Usually imports peak in the July to October period as retailers import goods for the Christmas holiday, and then decline sharply and bottom in the Winter depending on the timing of the Chinese New Year.
 Usually imports peak in the July to October period as retailers import goods for the Christmas holiday, and then decline sharply and bottom in the Winter depending on the timing of the Chinese New Year.
 Imports were up 46% YoY in February, and exports were up 14% YoY. There is usually a dip in the new year depending on the timing of the Chinese New Year, but that didn't happen this year.
In general, it appears port traffic is returning to the pre-pandemic patterns.
NAHB: Builder Confidence Increased in March
by Calculated Risk on 3/18/2024 10:00:00 AM
The National Association of Home Builders (NAHB) reported the housing market index (HMI) was at 51, up from 48 last month. Any number above 50 indicates that more builders view sales conditions as good than poor.
From the NAHB: Builder Sentiment Rises Above Breakeven Point
A lack of existing inventory that continues to drive buyers to new home construction, coupled with strong demand and mortgage rates below last fall’s cycle peak helped push builder sentiment above a key marker in March.
Builder confidence in the market for newly built single-family homes climbed three points to 51 in March, according to the National Association of Home Builders (NAHB)/Wells Fargo Housing Market Index (HMI) released today. This is the highest level since July 2023 and marks the fourth consecutive monthly gain for the index. It is also the first time that the sentiment level has surpassed the breakeven point of 50 since last July.
“Buyer demand remains brisk and we expect more consumers to jump off the sidelines and into the marketplace if mortgage rates continue to fall later this year,” said NAHB Chairman Carl Harris, a custom home builder from Wichita, Kan. “But even though there is strong pent-up demand, builders continue to face several supply-side challenges, including a scarcity of buildable lots and skilled labor, and new restrictive codes that continue to increase the cost of building homes.”
“With the Federal Reserve expected to announce future rate cuts in the second half of 2024, lower financing costs will draw many prospective buyers into the market,” said NAHB Chief Economist Robert Dietz. “However, as home building activity picks up, builders will likely grapple with rising material prices, particularly for lumber.”
With mortgage rates below 7% since mid-December per Freddie Mac, more builders are cutting back on reducing home prices to boost sales. In March, 24% of builders reported cutting home prices, down from 36% in December 2023 and the lowest share since July 2023. However, the average price reduction in March held steady at 6% for the ninth straight month. Meanwhile, the use of sales incentives is holding firm. The share of builders offering some form of incentive in March was 60%, and this has remained between 58% and 62% since last September.
...
All three of the major HMI indices posted gains in March. The HMI index charting current sales conditions increased four points to 56, the component measuring sales expectations in the next six months rose two points to 62 and the component gauging traffic of prospective buyers increased two points to 34.
Looking at the three-month moving averages for regional HMI scores, the Northeast increased two points to 59, the Midwest gained five points to 41, the South rose four points to 50 and the West registered a five-point gain to 43.
emphasis added
 Click on graph for larger image.
This graph shows the NAHB index since Jan 1985.
This was above the consensus forecast.
Housing March 18th Weekly Update: Inventory Up 1.3% Week-over-week, Up 22.2% Year-over-year
by Calculated Risk on 3/18/2024 08:17:00 AM
Altos reports that active single-family inventory was up 1.3% week-over-week. Inventory bottomed in mid-February, as opposed to mid-April in 2023, and inventory is now up 2.7% from the 2024 February bottom.
 Click on graph for larger image.
This inventory graph is courtesy of Altos Research.
As of March 15th, inventory was at 507 thousand (7-day average), compared to 501 thousand the prior week.
Inventory is still far below pre-pandemic levels. However, inventory is up 106% from the low for the same in 2022.

The red line is for 2024. The black line is for 2019. Note that inventory is up more than double from the record low for the same week in 2022, but still well below normal levels.
Inventory was up 22.2% compared to the same week in 2023 (last week it was up 21.1%), and down 38.5% compared to the same week in 2019 (last week it was down 38.7%).
Back in June 2023, inventory was down almost 54% compared to 2019, so the gap to more normal inventory levels has closed a little.
Mike Simonsen discusses this data regularly on Youtube.
Sunday, March 17, 2024
Sunday Night Futures
by Calculated Risk on 3/17/2024 09:05:00 PM
Weekend:
• Schedule for Week of March 17, 2024
Monday:
• At 10:00 AM ET, The March NAHB homebuilder survey. The consensus is for a reading of 48, unchanged from 48. Any number below 50 indicates that more builders view sales conditions as poor than good.
From CNBC: Pre-Market Data and Bloomberg futures S&P 500 are up 5 and DOW futures are down 27 (fair value).
Oil prices were up over the last week with WTI futures at $81.14 per barrel and Brent at $85.40 per barrel. A year ago, WTI was at $67, and Brent was at $71 - so WTI oil prices are up 20% year-over-year.
Here is a graph from Gasbuddy.com for nationwide gasoline prices. Nationally prices are at $3.44 per gallon. A year ago, prices were at $3.40 per gallon, so gasoline prices are up $0.04 year-over-year.
FOMC Preview: No Change to Policy Expected
by Calculated Risk on 3/17/2024 10:22:00 AM
Most analysts expect there will be no change to FOMC policy at the meeting this week, keeping the target range for the federal funds rate at 5‑1/4 to 5-1/2 percent. Some analysts expect Fed Chair Powell to take a slightly hawkish stance during the press conference, since the last two CPI reports were above expectations.
Currently market participants expect the next Fed move to be a 25 bp cut announced at the June FOMC meeting. The market is pricing in a 2nd cut in September - and a total of 3 cuts in 2024.
Projections will be released at this meeting. For review, here are the December projections. Since the last projections were released, the economy has performed close to FOMC expectations.
Early estimates for Q1 GDP are around 2% annualized, and it seems likely the FOMC will revise up the GDP projections for 2024.
| GDP projections of Federal Reserve Governors and Reserve Bank presidents, Change in Real GDP1 | ||||
|---|---|---|---|---|
| Projection Date | 2024 | 2025 | 2026 | |
| Dec 2023 | 1.2 to 1.7 | 1.5 to 2.0 | 1.8 to 2.0 | |
| Sept 2023 | 1.2 to 1.8 | 1.6 to 2.0 | 1.7 to 2.0 | |
The unemployment rate was at 3.9% in February and will likely be unrevised.
| Unemployment projections of Federal Reserve Governors and Reserve Bank presidents, Unemployment Rate2 | ||||
|---|---|---|---|---|
| Projection Date | 2024 | 2025 | 2026 | |
| Dec 2023 | 4.0 to 4.2 | 4.0 to 4.2 | 3.9 to 4.3 | |
| Sept 2023 | 3.9 to 4.4 | 3.9 to 4.3 | 3.8 to 4.3 | |
As of January 2024, PCE inflation increased 2.4 percent year-over-year (YoY). The projections for PCE inflation will likely not be revised.
| Inflation projections of Federal Reserve Governors and Reserve Bank presidents, PCE Inflation1 | ||||
|---|---|---|---|---|
| Projection Date | 2024 | 2025 | 2026 | |
| Dec 2023 | 2.2 to 2.5 | 2.0 to 2.2 | 2.0 | |
| Sept 2023 | 2.3 to 2.7 | 2.0 to 2.3 | 2.0 to 2.2 | |
PCE core inflation increased 2.8 percent YoY in January. This will likely be unrevised.
Over the last 6 months, the PCE Price Index increase 2.5% annualized, the core PCE price index increased at a 2.5% annual rate. However, core PCE minus Housing increased at a 1.8% annualized rate suggesting that 2024 projections are too high.
| Core Inflation projections of Federal Reserve Governors and Reserve Bank presidents, Core Inflation1 | ||||
|---|---|---|---|---|
| Projection Date | 2024 | 2025 | 2026 | |
| Dec 2023 | 2.4 to 2.7 | 2.0 to 2.2 | 2.0 to 2.1 | |
| Sept 2023 | 2.5 to 2.8 | 2.0 to 2.4 | 2.0 to 2.3 | |
Saturday, March 16, 2024
Real Estate Newsletter Articles this Week: Current State of the Housing Market
by Calculated Risk on 3/16/2024 02:11:00 PM
At the Calculated Risk Real Estate Newsletter this week:
• Part 1: Current State of the Housing Market; Overview for mid-March 2024
• Part 2: Current State of the Housing Market; Overview for mid-March 2024
• Q4 Update: Delinquencies, Foreclosures and REO
• 3rd Look at Local Housing Markets in February
• Lawler: Rent Trends at some Large Holders of Multifamily Properties
• 2nd Look at Local Housing Markets in February
This is usually published 4 to 6 times a week and provides more in-depth analysis of the housing market.
Schedule for Week of March 17, 2024
by Calculated Risk on 3/16/2024 08:11:00 AM
The key reports this week are February Housing Starts and Existing Home Sales.
The FOMC meets this week, and no change to policy is expected.
10:00 AM: The March NAHB homebuilder survey. The consensus is for a reading of 48, unchanged from 48. Any number below 50 indicates that more builders view sales conditions as poor than good.
 8:30 AM: Housing Starts for February.
 This graph shows single and multi-family housing starts since 1968.
The consensus is for 1.435 million SAAR, up from 1.331 million SAAR.
7:00 AM ET: The Mortgage Bankers Association (MBA) will release the results for the mortgage purchase applications index.
During the day: The AIA's Architecture Billings Index for February (a leading indicator for commercial real estate).
2:00 PM: FOMC Meeting Announcement. No change to policy is expected at this meeting.
2:00 PM: FOMC Projections. This will include the Federal Open Market Committee (FOMC) participants' projections of the appropriate target federal funds rate along with updated economic projections.
2:30 PM: Fed Chair Jerome Powell holds a press briefing following the FOMC announcement.
8:30 AM: The initial weekly unemployment claims report will be released. The consensus is for 212 thousand initial claims, up from 209 thousand last week.
8:30 AM: the Philly Fed manufacturing survey for March. The consensus is for a reading of -2.5, down from 5.2.
 10:00 AM: Existing Home Sales for February from the National Association of Realtors (NAR). The consensus is for 3.94 million SAAR, down from 4.00 million.
The graph shows existing home sales from 1994 through the report last month.
Housing economist Tom Lawler expects the NAR to report sales of 4.40 million SAAR for February (well above consensus).
----- Friday, March 22nd -----
10:00 AM: State Employment and Unemployment (Monthly) for February 2024
10:00 AM: State Employment and Unemployment (Monthly) for February 2024
Friday, March 15, 2024
March 15th COVID Update: Weekly Deaths Decreased
by Calculated Risk on 3/15/2024 07:46:00 PM
 Note: Mortgage rates are from MortgageNewsDaily.com and are for top tier scenarios.
Due to changes at the CDC, weekly cases are no longer updated.
For deaths, I'm currently using 4 weeks ago for "now", since the most recent three weeks will be revised significantly.
Hospitalizations have declined significantly from the winter high of 30,023 earlier this year but are still more than double the low of 5,380 last year.
| COVID Metrics | ||||
|---|---|---|---|---|
| Now | Week Ago | Goal | ||
| Hospitalized2 | 12,259 | 14,270 | ≤3,0001 | |
| Deaths per Week2 | 1,259 | 1,518 | ≤3501 | |
| 1my goals to stop weekly posts, 2Weekly for Currently Hospitalized, and Deaths 🚩 Increasing number weekly for Hospitalized and Deaths ✅ Goal met. | ||||
 Click on graph for larger image.
This graph shows the weekly (columns) number of deaths reported.
Weekly deaths have declined sharply from the recent peak of 2,528 but are still more than double the low of 489 last July.
 This appears to be a leading indicator for COVID hospitalizations and deaths.
Nationally, COVID in wastewater is now off more than 75% from the holiday peak at the end of December, and that suggests weekly hospitalizations and deaths will continue to decline.
Lawler: Early Read on Existing Home Sales in February
by Calculated Risk on 3/15/2024 04:15:00 PM
From housing economist Tom Lawler:
Based on publicly-available local realtor/MLS reports released across the country through today, I project that existing home sales as estimated by the National Association of Realtors ran at a seasonally adjusted annual rate of 4.40 million in February, up 10% from January’s preliminary pace but down 2.9% from last February’s seasonally adjusted pace. Unadjusted sales should show a small YOY gain, with the SA/NSA difference reflecting the higher business day count this February compared with last February.
Local realtor/MLS reports suggest that the median existing single-family home sales price last month was up by about 6.5% from last February.
CR Note: The National Association of Realtors (NAR) is scheduled to release February existing home sales on Thursday, March 21st, at 10:00 AM ET. The consensus is for 3.94 million SAAR.
3rd Look at Local Housing Markets in February
by Calculated Risk on 3/15/2024 01:44:00 PM
Today, in the Calculated Risk Real Estate Newsletter: 3rd Look at Local Housing Markets in February
A brief excerpt:
NOTE: The tables for active listings, new listings and closed sales all include a comparison to February 2019 for each local market (some 2019 data is not available).There is much more in the article.
This is the third look at several local markets in February. I’m tracking about 40 local housing markets in the US. Some of the 40 markets are states, and some are metropolitan areas. I’ll update these tables throughout the month as additional data is released.
Closed sales in February were mostly for contracts signed in December and January when 30-year mortgage rates averaged 6.82% and 6.64%, respectively. This is down from the 7%+ mortgage rates in the August through November period.
...
In February, sales in these markets were up 1.4% YoY. In January, these same markets were up 2.4% year-over-year Not Seasonally Adjusted (NSA).
Sales in most of these markets are down compared to January 2019.
...
More local markets to come!


