by Calculated Risk on 3/26/2024 07:42:00 PM
Tuesday, March 26, 2024
Wednesday: Mortgage Applications

Wednesday:
• At 7:00 AM ET, The Mortgage Bankers Association (MBA) will release the results for the mortgage purchase applications index.
A few comments on the Seasonal Pattern for House Prices
by Calculated Risk on 3/26/2024 01:00:00 PM
Two key points:
1) There is a clear seasonal pattern for house prices.
2) The surge in distressed sales during the housing bust distorted the seasonal pattern. This was because distressed sales (at lower price points) happened at a steady rate all year, while regular sales followed the normal seasonal pattern. This made for larger swings in the seasonal factor during the housing bust.

This graph shows the month-to-month change in the NSA Case-Shiller National index since 1987 (through January 2024). The seasonal pattern was smaller back in the '90s and early '00s and increased once the bubble burst.
The seasonal swings declined following the bust, however the pandemic price surge changed the month-over-month pattern.

The swings in the seasonal factors were decreasing following the bust but have increased again recently - this time without a surge in distressed sales.
Comments on January House Prices, FHFA: House Prices Declined Slightly in January
by Calculated Risk on 3/26/2024 09:51:00 AM
Today, in the Calculated Risk Real Estate Newsletter: Case-Shiller: National House Price Index Up 6.0% year-over-year in January; FHFA: House Prices Declined Slightly in January, up 6.3% YoY
Excerpt:
S&P/Case-Shiller released the monthly Home Price Indices for January ("January" is a 3-month average of November, December and January closing prices). January closing prices include some contracts signed in September, so there is a significant lag to this data. Here is a graph of the month-over-month (MoM) change in the Case-Shiller National Index Seasonally Adjusted (SA).
The MoM increase in the seasonally adjusted (SA) Case-Shiller National Index was at 0.36%. This was the twelfth consecutive MoM increase, and a larger MoM increase than the previous two months.
On a seasonally adjusted basis, prices increased month-to-month in 13 of the 20 Case-Shiller cities. Seasonally adjusted, San Francisco has fallen 8.4% from the recent peak, Seattle is down 7.1% from the peak, Portland down 4.8%, and Phoenix is down 3.6%.
Case-Shiller: National House Price Index Up 6.0% year-over-year in January
by Calculated Risk on 3/26/2024 09:00:00 AM
S&P/Case-Shiller released the monthly Home Price Indices for January ("January" is a 3-month average of November, December and January closing prices).
This release includes prices for 20 individual cities, two composite indices (for 10 cities and 20 cities) and the monthly National index.
From S&P S&P CoreLogic Case-Shiller Index Continues to Trend Upward in January 2024
The S&P CoreLogic Case-Shiller U.S. National Home Price NSA Index, covering all nine U.S. census divisions, reported a 6.0% annual gain in January, up from a 5.6% rise in the previous month. The 10- City Composite showed an increase of 7.4%, up from a 7.0% increase in the previous month. The 20- City Composite posted a year-over-year increase of 6.6%, up from a 6.2% increase in the previous month. San Diego again reported the highest year-over-year gain among the 20 cities with an 11.2% increase in January, followed by Los Angeles, with an increase of 8.6%. Portland, though holding the lowest rank after reporting the smallest year-over-year growth, retained an upward trend with a 0.9% increase this month.
...
The U.S. National Index and the 20-City Composite showed a continued decrease of 0.1%, and 10-City Composite remained unchanged in January.
After seasonal adjustment, the U.S. National Index, the 20-City Composite, and the 10-City Composite all posted month-over-month increases of 0.4%, 0.1%, and 0.2% respectively.
“U.S. home prices continued their drive higher,” says Brian D. Luke, Head of Commodities, Real & Digital Assets at S&P Dow Jones Indices. “Our National Composite rose by 6% in January, the fastest annual rate since 2022. Stronger gains came from our 10- and 20-City Composite indices, rising 7.4% and 6.6%, respectively. For the second consecutive month, all cities reported increases in annual prices, with San Diego surging 11.2%. On a seasonal adjusted basis, home prices have continued to break through previous all-time highs set last year”
emphasis added
 Click on graph for larger image.
 The first graph shows the nominal seasonally adjusted Composite 10, Composite 20 and National indices (the Composite 20 was started in January 2000).
The Composite 10 index is up 0.2% in January (SA). The Composite 20 index is up 0.1% (SA) in January.
The National index is up 0.4% (SA) in January.
 The second graph shows the year-over-year change in all three indices.
The Composite 10 SA is up 7.4% year-over-year. The Composite 20 SA is up 6.6% year-over-year.
The National index SA is up 6.0% year-over-year.
Annual price changes were at expectations. I'll have more later.
Monday, March 25, 2024
Tuesday: Case-Shiller House Prices, Durable Goods, Richmond and Dallas Fed Mfg
by Calculated Risk on 3/25/2024 07:37:00 PM

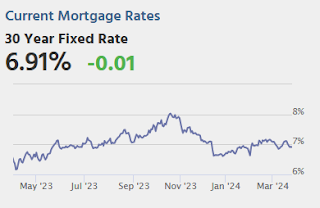
Mortgage rates enjoyed a decently strong week last week, with the average top tier conventional 30yr fixed rate moving down to 6.91% by Friday from 7.09% on the previous Friday. To put today's "unchanged" headline in perspective, that same number is up to 6.92% this afternoon. [30 year fixed 6.92%]Tuesday:
emphasis added
• At 8:30 AM ET, Durable Goods Orders for February from the Census Bureau. The consensus is for a 1.0% increase in durable goods orders.
• At 9:00 AM, S&P/Case-Shiller House Price Index for January. The consensus is for a 5.8% year-over-year increase in the National index for January, up from 5.5% YoY in December.
• Also at 9:00 AM, FHFA House Price Index for January 2021. This was originally a GSE only repeat sales, however there is also an expanded index.
• At 10:00 AM, Richmond Fed Survey of Manufacturing Activity for March.
• At 10:30 AM, Dallas Fed Survey of Manufacturing Activity for March.
March Vehicle Sales Forecast: 15.6 million SAAR, Up 5% YoY
by Calculated Risk on 3/25/2024 01:47:00 PM
From WardsAuto: March U.S. Light-Vehicle Sales Tracking a Steady Course with Potential Upside (pay content). Brief excerpt:
If the March forecast holds firm, the first quarter will total a 15.5 million-unit seasonally adjusted annual rate, down from Q4-2023’s 15.7 million but up from like-2023’s 15.0 million. However, the forecasted steady climb in inventory should put sales in good stead to rise above 16-million-unit annualized rates for most of the remainder of 2024.
emphasis added
 Click on graph for larger image.
This graph shows actual sales from the BEA (Blue), and Wards forecast for March (Red).
On a seasonally adjusted annual rate basis, the Wards forecast of 15.6 million SAAR, would be down 1% from last month, and up 5% from a year ago.
New Home Sales at 662,000 Annual Rate in February; Median New Home Price is Down 19% from the Peak
by Calculated Risk on 3/25/2024 10:43:00 AM
Today, in the Calculated Risk Real Estate Newsletter: New Home Sales at 662,000 Annual Rate in February
Brief excerpt:
The Census Bureau reports New Home Sales in February were at a seasonally adjusted annual rate (SAAR) of 662 thousand. The previous three months were revised up slightly.There is much more in the article.
...
The next graph shows new home sales for 2023 and 2024 by month (Seasonally Adjusted Annual Rate). Sales in February 2024 were up 5.9% from February 2023.
...
Note that the median and average price are down due to the mix of homes sold, not because of large price declines. Homebuilders are building less expensive homes to keep up volumes.
New Home Sales at 662,000 Annual Rate in February
by Calculated Risk on 3/25/2024 10:00:00 AM
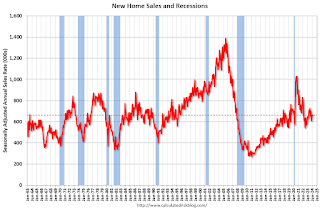
The Census Bureau reports New Home Sales in February were at a seasonally adjusted annual rate (SAAR) of 662 thousand.
The previous three months were revised up slightly.
Sales of new single‐family houses in February 2024 were at a seasonally adjusted annual rate of 662,000, according to estimates released jointly today by the U.S. Census Bureau and the Department of Housing and Urban Development. This is 0.3 percent below the revised January rate of 664,000, but is 5.9 percent above the February 2023 estimate of 625,000.
emphasis added
 Click on graph for larger image.
The first graph shows New Home Sales vs. recessions since 1963. The dashed line is the current sales rate.
New home sales were close to pre-pandemic levels.
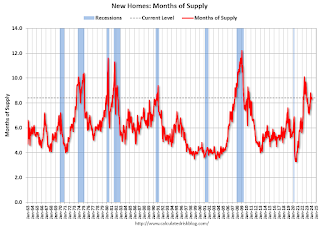
The second graph shows New Home Months of Supply.
 The months of supply increased in February to 8.4 months from 8.3 months in January.
 The all-time record high was 12.2 months of supply in January 2009. The all-time record low was 3.3 months in August 2020.
This is well above the top of the normal range (about 4 to 6 months of supply is normal).
"The seasonally‐adjusted estimate of new houses for sale at the end of February was 463,000. This represents a supply of 8.4 months at the current sales rate."Sales were below expectations of 673 thousand SAAR, however, sales for the three previous months were revised up slightly. I'll have more later today.
Housing March 25th Weekly Update: Inventory Up 1.1% Week-over-week, Up 23.9% Year-over-year
by Calculated Risk on 3/25/2024 08:16:00 AM
 Click on graph for larger image.
This inventory graph is courtesy of Altos Research.

Sunday, March 24, 2024
Monday: New Home Sales
by Calculated Risk on 3/24/2024 07:24:00 PM
Weekend:
• Schedule for Week of March 24, 2024
Monday:
• At 8:30 AM ET, Chicago Fed National Activity Index for February. This is a composite index of other data.
• At 10:00 AM, New Home Sales for February from the Census Bureau. The consensus is for 673 thousand SAAR, up from 661 thousand in January.
From CNBC: Pre-Market Data and Bloomberg futures S&P 500 are down 4 and DOW futures are down 47 (fair value).
Oil prices were down over the last week with WTI futures at $80.63 per barrel and Brent at $85.43 per barrel. A year ago, WTI was at $69, and Brent was at $74 - so WTI oil prices are up 17% year-over-year.
Here is a graph from Gasbuddy.com for nationwide gasoline prices. Nationally prices are at $3.53 per gallon. A year ago, prices were at $3.41 per gallon, so gasoline prices are up $0.12 year-over-year.


