 RSS Feed
 by Calculated Risk on 3/30/2024 08:11:00 AM
Saturday, March 30, 2024
Schedule for Week of March 31, 2024
The key report scheduled for this week is the March employment report on Friday.
Other key reports include the February Trade Deficit and March Auto Sales.
For manufacturing, the March ISM Manufacturing survey will be released.
10:00 AM: ISM Manufacturing Index for March. The consensus is for the ISM to be at 48.5, up from 47.8 in February.
10:00 AM: Construction Spending for February. The consensus is for 0.5% increase in construction spending.
8:00 AM: Corelogic House Price index for February.
 10:00 AM ET: Job Openings and Labor Turnover Survey for February from the BLS.
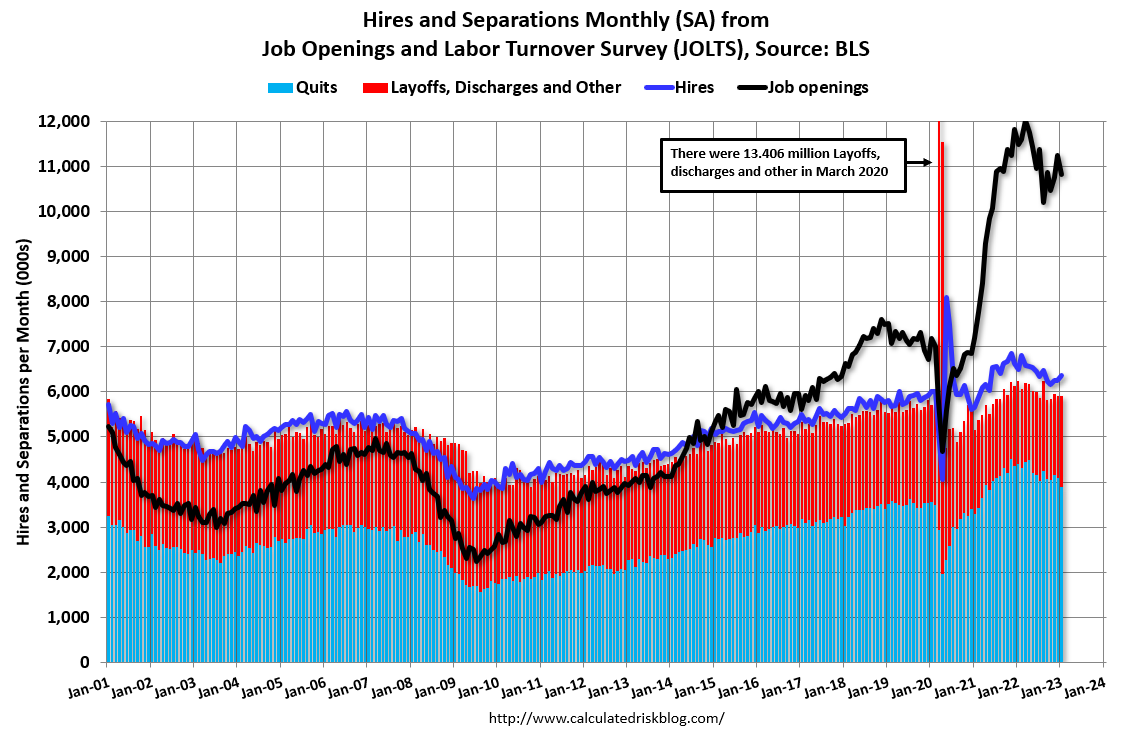
 This graph shows job openings (black line), hires (dark blue), Layoff, Discharges and other (red column), and Quits (light blue column) from the JOLTS.
Jobs openings decreased slightly in January to 8.86 million from 8.89 million in December.
The number of job openings (black) were down 15% year-over-year. Quits were down 13% year-over-year.
 All Day: Light vehicle sales for March. The consensus is for light vehicle sales to be 15.9 million SAAR in March, up from 15.8 million in February (Seasonally Adjusted Annual Rate).
This graph shows light vehicle sales since the BEA started keeping data in 1967. The dashed line is the February sales rate.
7:00 AM ET: The Mortgage Bankers Association (MBA) will release the results for the mortgage purchase applications index.
8:15 AM: The ADP Employment Report for March. This report is for private payrolls only (no government). The consensus is for 155,000 payroll jobs added in March, up from 140,000 added in February.
10:00 AM: the ISM Services Index for March.
8:30 AM: The initial weekly unemployment claims report will be released. The consensus is for 208 thousand initial claims, down from 210 thousand last week.
 8:30 AM: Trade Balance report for February from the Census Bureau.
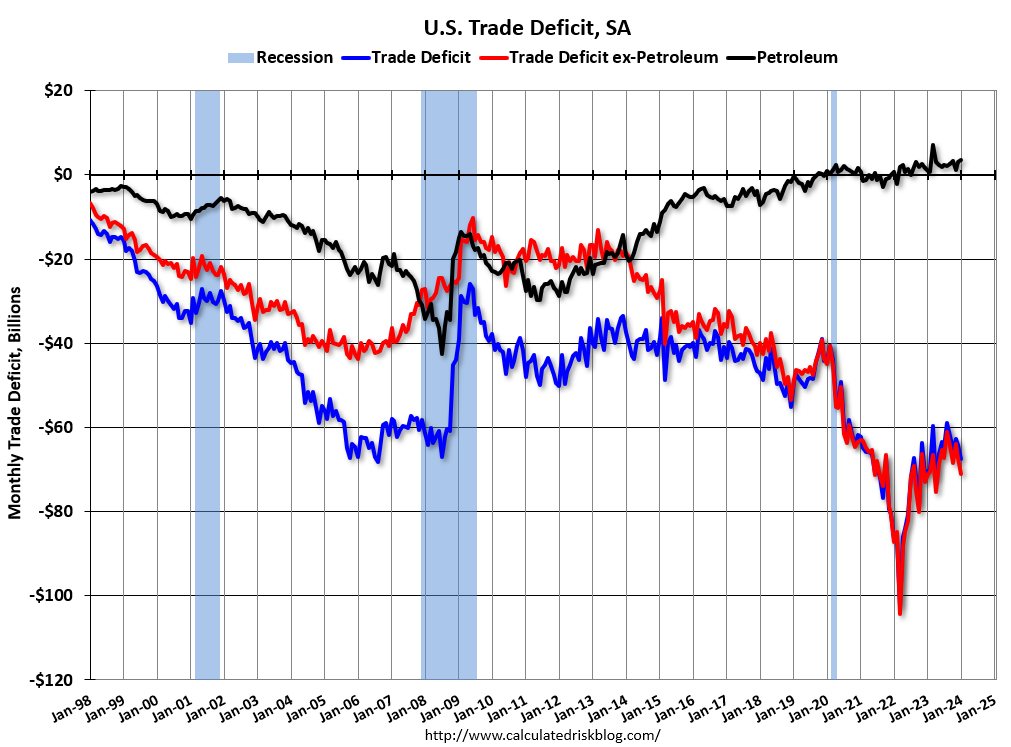
 This graph shows the U.S. trade deficit, with and without petroleum, through the most recent report. The blue line is the total deficit, and the black line is the petroleum deficit, and the red line is the trade deficit ex-petroleum products.
The consensus is the trade deficit to be $66.5 billion. The U.S. trade deficit was at $67.4 billion in January.
 8:30 AM: Employment Report for March. The consensus is for 200,000 jobs added, and for the unemployment rate to be unchanged at 3.9%.
There were 275,000 jobs added in February, and the unemployment rate was at 3.9%.
This graph shows the jobs added per month since January 2021.
Friday, March 29, 2024
March 29th COVID Update: Weekly Deaths Decreased
by Calculated Risk on 3/29/2024 07:17:00 PM
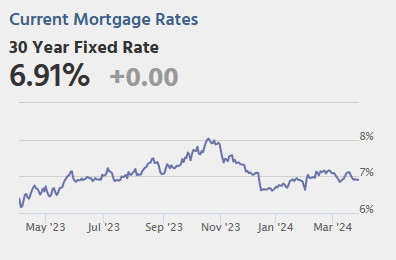 Note: Mortgage rates are from MortgageNewsDaily.com and are for top tier scenarios.
Due to changes at the CDC, weekly cases are no longer updated.
For deaths, I'm currently using 4 weeks ago for "now", since the most recent three weeks will be revised significantly.
Hospitalizations have declined significantly from the winter high of 30,025 but are still above the low of 5,380 last year.
| COVID Metrics | ||||
|---|---|---|---|---|
| Now | Week Ago | Goal | ||
| Hospitalized2 | 8,584 | 10,326 | ≤3,0001 | |
| Deaths per Week2 | 1,164 | 1,234 | ≤3501 | |
| 1my goals to stop weekly posts, 2Weekly for Currently Hospitalized, and Deaths 🚩 Increasing number weekly for Hospitalized and Deaths ✅ Goal met. | ||||
 Click on graph for larger image.
This graph shows the weekly (columns) number of deaths reported.
Weekly deaths have declined sharply from the recent peak of 2,547 but are still more than double the low of 490 last July.
 This appears to be a leading indicator for COVID hospitalizations and deaths.
Nationally, COVID in wastewater is now off more than 85% from the holiday peak at the end of December, and that suggests weekly hospitalizations and deaths will continue to decline.
FHFA’s National Mortgage Database: Outstanding Mortgage Rates, LTV and Credit Scores
by Calculated Risk on 3/29/2024 02:09:00 PM
Today, in the Calculated Risk Real Estate Newsletter: FHFA’s National Mortgage Database: Outstanding Mortgage Rates, LTV and Credit Scores
A brief excerpt:
Here are some graphs on outstanding mortgages by interest rate, the average mortgage interest rate, borrowers’ credit scores and current loan-to-value (LTV) from the FHFA’s National Mortgage Database through Q4 2023 (released this morning).There is much more in the article.
...
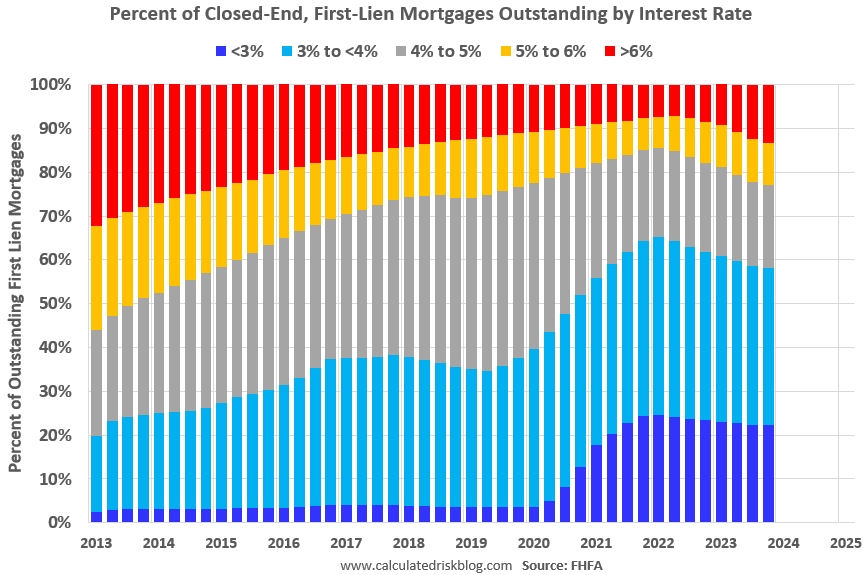
Here is some data showing the distribution of interest rates on closed-end, fixed-rate 1-4 family mortgages outstanding at the end of each quarter since Q1 2013 through Q4 2023.
This shows the surge in the percent of loans under 3%, and also under 4%, starting in early 2020 as mortgage rates declined sharply during the pandemic. The percent of outstanding loans under 4% peaked in Q1 2022 at 65.3% (now at 58.1%), and the percent under 5% peaked at 85.6% (now at 77.0%). These low existing mortgage rates makes it difficult for homeowners to sell their homes and buy a new home since their monthly payments would increase sharply. This is a key reason existing home inventory levels are so low. See: "The Lock-In Effect of Rising Mortgage Rates"
The percent of loans over 6% bottomed in Q2 2022 at 7.2% and has increased to 13.4% in Q4 2023.
Q1 GDP Tracking: Just Over 2%
by Calculated Risk on 3/29/2024 11:47:00 AM
From BofA:
1Q GDP tracking remained at 2.2% q/q saar largely due to downward revisions to core capital goods orders and shipments and lower than expected core capital goods shipments being offset by higher than expected manufacturing inventories in the February durable goods print [Mar 28th estimate]From Goldman:
emphasis added
After incorporating this morning’s data and yesterday’s GDP release, we have increased our Q1 GDP tracking estimate by 0.3pp to +2.1% (qoq ar), reflecting stronger consumption growth and a larger contribution from inventory accumulation that more than offset a slightly wider trade deficit. Our Q1 domestic final sales forecast now stands at +2.9% (qoq ar). [Mar 29th estimate]And from the Altanta Fed: GDPNow
The GDPNow model estimate for real GDP growth (seasonally adjusted annual rate) in the first quarter of 2024 is 2.3 percent on March 29, up from 2.1 percent on March 26. After recent releases from the US Census Bureau and the US Bureau of Economic Analysis, the nowcast of first-quarter real personal consumption expenditures growth increased from 1.9 percent to 2.6 percent, while the nowcast of the contribution of the change in real net exports to first-quarter real GDP growth decreased from -0.16 percentage points to -0.47 percentage points. [March 29th estimate]
PCE Measure of Shelter Slows to 5.8% YoY in February
by Calculated Risk on 3/29/2024 08:56:00 AM
Here is a graph of the year-over-year change in shelter from the CPI report and housing from the PCE report this morning, both through February 2024.
 CPI Shelter was up 5.8% year-over-year in February, down from 6.1% in January, and down from the cycle peak of 8.2% in March 2023.
Housing (PCE) was up 5.8% YoY in February, down from 6.1% in January, and down from the cycle peak of 8.3% in April 2023.
Since asking rents are mostly flat year-over-year, these measures will continue to slow over the next year.
Since asking rents are mostly flat year-over-year, these measures will continue to slow over the next year.
The second graph shows PCE prices, Core PCE prices and Core ex-housing over the last 6 months (annualized):
 Key measures are slightly above the Fed's target on a 6-month basis.
PCE Price Index: 2.5%
Core PCE Prices: 2.9%
Core minus Housing: 2.3%
Personal Income increased 0.3% in February; Spending increased 0.8%
by Calculated Risk on 3/29/2024 08:30:00 AM
From the BEA: Personal Income and Outlays for February:
Personal income increased $66.5 billion (0.3 percent at a monthly rate) in February, according to estimates released today by the Bureau of Economic Analysis. Disposable personal income (DPI), personal income less personal current taxes, increased $50.3 billion (0.2 percent) and personal consumption expenditures (PCE) increased $145.5 billion (0.8 percent).The February PCE price index increased 2.5 percent year-over-year (YoY), up from 2.4 percent YoY in January, and down from the peak of 7.1 percent in June 2022.
The PCE price index increased 0.3 percent. Excluding food and energy, the PCE price index increased 0.3 percent. Real DPI decreased 0.1 percent in February and real PCE increased 0.4 percent; goods increased 0.1 percent and services increased 0.6 percent .
emphasis added
The PCE price index, excluding food and energy, increased 2.8 percent YoY, down from 2.9 percent in January, and down from the peak of 5.6 percent in February 2022.
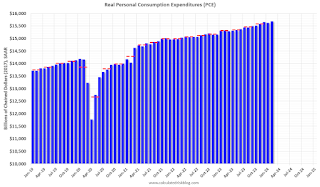
The following graph shows real Personal Consumption Expenditures (PCE) through January 2024 (2017 dollars). Note that the y-axis doesn't start at zero to better show the change.
 Click on graph for larger image.
The dashed red lines are the quarterly levels for real PCE.
Personal income was above expectations and PCE was at expectations.
Inflation was at expectations.
Using the two-month method to estimate Q1 real PCE growth, real PCE was increasing at a 2.7% annual rate in Q1 2024. (Using the mid-month method, real PCE was increasing at 2.7%). This suggests solid PCE growth in Q1.
Thursday, March 28, 2024
Friday: Personal Income and Outlays, PCE Prices, Fed Chair Powell
by Calculated Risk on 3/28/2024 07:50:00 PM
All US markets will be closed in observance of Good Friday.
 Note: Mortgage rates are from MortgageNewsDaily.com and are for top tier scenarios.
Friday:
• At 8:30 AM ET, Personal Income and Outlays for February. The consensus is for a 0.4% increase in personal income, and for a 0.5% increase in personal spending. And for the Core PCE price index to increase 0.3%. PCE prices are expected to be up 2.5% YoY, and core PCE prices up 2.8% YoY.
• At 11:30 AM, Discussion, Fed Chair Jerome Powell, Moderated Discussion with Kai Ryssdal, At the Federal Reserve Bank of San Francisco Macroeconomics and Monetary Policy Conference, San Francisco, Calif
Realtor.com Reports Active Inventory UP 25.5% YoY; New Listings up 14.9% YoY
by Calculated Risk on 3/28/2024 02:43:00 PM
What this means: On a weekly basis, Realtor.com reports the year-over-year change in active inventory and new listings. On a monthly basis, they report total inventory. For February, Realtor.com reported inventory was up 14.8% YoY, but still down almost 40% compared to February 2019.
Now - on a weekly basis - inventory is up 25.5% YoY.
Realtor.com has monthly and weekly data on the existing home market. Here is their weekly report: Weekly Housing Trends View—Data Week Ending March 23, 2024 Here is a graph of the year-over-year change in inventory according to realtor.com.
Inventory was up year-over-year for the 20th consecutive week following 20 consecutive weeks with a YoY decrease in inventory.
Realtor.com has monthly and weekly data on the existing home market. Here is their weekly report: Weekly Housing Trends View—Data Week Ending March 23, 2024
• Active inventory increased, with for-sale homes 25.5% above year ago levels.
For an 20th straight week, active listings registered above prior year level, which means that today’s home shoppers are able to consider more options for existing homes for sale. However, the number of homes on the market is still down nearly 40% compared to what was typical in 2017 to 2019 and the gain in inventory, particularly in the more affordable under $350,000 price category, was primarily focused in the South last month. Nonetheless, in the first few weeks of March, inventory growth has also accelerated in the Midwest and West, while inventory in the Northeast remains similar to the previous year.
• New listings–a measure of sellers putting homes up for sale–were up this week, by 14.9% from one year ago.
For the 22nd consecutive week, newly listed homes have surpassed levels from a year ago. While the annual growth rate was slower than the 17.8% recorded a week earlier, it remains among the fastest increase rates in new listings since June 2021. This indicates a surge in fresh options for buyers as we approach the spring homebuying season. However, it’s worth noting that the inventory base for this growth remains relatively small.
 Here is a graph of the year-over-year change in inventory according to realtor.com.
 Inventory was up year-over-year for the 20th consecutive week following 20 consecutive weeks with a YoY decrease in inventory.
Inventory is still historically very low.
Although new listings remain below typical pre-pandemic levels, new listings are now up YoY for the 22nd consecutive week.
Final Look at Local Housing Markets in February
by Calculated Risk on 3/28/2024 11:35:00 AM
Today, in the Calculated Risk Real Estate Newsletter: Final Look at Local Housing Markets in February
A brief excerpt:
Note: Most analysts were surprised by the increase in sales in February. Not housing economist Tom Lawler, or any readers of this newsletter. The local data clearly showed that sales - as reported by the NAR - would be up solidly in February. This is one of the reasons I track local markets. It is also useful to track inventory, both new and active.There is much more in the article.
After the National Association of Realtors® (NAR) releases the monthly existing home sales report, I pick up additional local market data that is reported after the NAR. This is the final look at local markets in February.
I’ve added a comparison of active listings, new listings, and closings to the same month in 2019 (for markets with available data). This gives us a sense of the current low level of sales and inventory, and also shows some significant regional differences.
The big stories for February were that existing home sales increased to 4.38 million on a seasonally adjusted annual rate basis (SAAR), and new listings were up YoY for the 5th consecutive month!
...
And here is a table for new listings in February (some areas don’t report new listings). For these areas, new listings were up 21.8% year-over-year.
Last month, new listings in these markets were up 8.6% year-over-year.
New listings are now up solidly year-over-year, but still at historically low levels. New listings in most of these areas are down compared to January 2019 activity.
...
More local data coming in April for activity in March!

NAR: Pending Home Sales Increase 1.6% in February; Down 7.0% Year-over-year
by Calculated Risk on 3/28/2024 10:00:00 AM
From the NAR: Pending Home Sales Rose 1.6% in February
Pending home sales in January grew 1.6%, according to the National Association of REALTORS®. The Midwest and South posted monthly gains in transactions while the Northeast and West recorded losses. All four U.S. regions registered year-over-year decreases.This was slightly above expectations. Note: Contract signings usually lead sales by about 45 to 60 days, so this would usually be for closed sales in March and April.
The Pending Home Sales Index (PHSI)* – a forward-looking indicator of home sales based on contract signings – increased to 75.6 in February. Year over year, pending transactions were down 7.0%. An index of 100 is equal to the level of contract activity in 2001.
...
The Northeast PHSI decreased 0.3% from last month to 63.4, a decline of 9.0% from February 2023. The Midwest index soared 10.6% to 81.6 in February, down 2.5% from one year ago.
The South PHSI rose 1.1% to 89.5 in February, falling 8.5% from the prior year. The West index fell 6.5% in February to 57.1, down 7.9% from February 2023.
emphasis added


