by Calculated Risk on 4/03/2024 10:00:00 AM
Wednesday, April 03, 2024
ISM® Services Index decreases to 51.4% in March
(Posted with permission). The ISM® Services index was at 51.4%, down from 52.6% last month. The employment index increased to 48.5%, from 48.0%. Note: Above 50 indicates expansion, below 50 in contraction.
From the Institute for Supply Management: Services PMI® at 51.4% March 2024 Services ISM® Report On Business®
Economic activity in the services sector expanded in March for the 15th consecutive month as the Services PMI® registered 51.4 percent, say the nation's purchasing and supply executives in the latest Services ISM® Report On Business®. The sector has grown in 45 of the last 46 months, with the lone contraction in December 2022.The PMI was below expectations.
The report was issued today by Anthony Nieves, CPSM, C.P.M., A.P.P., CFPM, Chair of the Institute for Supply Management® (ISM®) Services Business Survey Committee: “In March, the Services PMI® registered 51.4 percent, 1.2 percentage points lower than February’s reading of 52.6 percent. The composite index indicated growth in March for the 15th consecutive month after a reading of 49 percent in December 2022, which was the first contraction since May 2020 (45.4 percent). The Business Activity Index registered 57.4 percent in March, which is 0.2 percentage point higher than the 57.2 percent recorded in February. The New Orders Index expanded in March for the 15th consecutive month after contracting in December 2022 for the first time since May 2020; the figure of 54.4 percent is 1.7 percentage points lower than the February reading of 56.1 percent. The Employment Index contracted for the third time in four months with a reading of 48.5 percent, a 0.5-percentage point increase compared to the 48 percent recorded in February.
emphasis added
ADP: Private Employment Increased 184,000 in March
by Calculated Risk on 4/03/2024 08:15:00 AM
Private sector employment increased by 184,000 jobs in March and annual pay was up 5.1 percent year-over-year, according to the March ADP® National Employment ReportTM produced by the ADP Research Institute® in collaboration with the Stanford Digital Economy Lab (“Stanford Lab”). ...This was above the consensus forecast of 155,000. The BLS report will be released Friday, and the consensus is for 200 thousand non-farm payroll jobs added in March.
“March was surprising not just for the pay gains, but the sectors that recorded them. The three biggest increases for job-changers were in construction, financial services, and manufacturing,” said Nela Richardson, chief economist, ADP. “Inflation has been cooling, but our data shows pay is heating up in both goods and services.”
emphasis added
MBA: Mortgage Applications Decreased in Weekly Survey
by Calculated Risk on 4/03/2024 07:00:00 AM
From the MBA: Mortgage Applications Decrease in Latest MBA Weekly Survey
Mortgage applications decreased 0.6 percent from one week earlier, according to data from the Mortgage Bankers Association’s (MBA) Weekly Mortgage Applications Survey for the week ending March 29, 2024.
The Market Composite Index, a measure of mortgage loan application volume, decreased 0.6 percent on a seasonally adjusted basis from one week earlier. On an unadjusted basis, the Index decreased 0.1 percent compared with the previous week. The Refinance Index decreased 2 percent from the previous week and was 5 percent lower than the same week one year ago. The seasonally adjusted Purchase Index decreased 0.1 percent from one week earlier. The unadjusted Purchase Index increased 1 percent compared with the previous week and was 13 percent lower than the same week one year ago.
“Mortgage rates moved lower last week, but that did little to ignite overall mortgage application activity. The 30-year fixed mortgage rate declined slightly to 6.91 percent, while the 15-year fixed rate decreased to its lowest level in two months at 6.35 percent,” said Joel Kan, MBA’s Vice President and Deputy Chief Economist. “Elevated mortgage rates continued to weigh down on home buying. Purchase applications were unchanged overall, although FHA purchases did pick up slightly over the week. Refinance applications decreased to fall 5 percent below last year’s pace.”
...
The average contract interest rate for 30-year fixed-rate mortgages with conforming loan balances ($766,550 or less) decreased to 6.91 percent from 6.93 percent, with points decreasing to 0.59 from 0.60 (including the origination fee) for 80 percent loan-to-value ratio (LTV) loans.
emphasis added
 Click on graph for larger image.
The first graph shows the MBA mortgage purchase index.
According to the MBA, purchase activity is down 13% year-over-year unadjusted.

Tuesday, April 02, 2024
Wednesday: ADP Employment, ISM Services
by Calculated Risk on 4/02/2024 08:52:00 PM

Wednesday:
• At 7:00 AM ET, The Mortgage Bankers Association (MBA) will release the results for the mortgage purchase applications index.
• At 8:15 AM, The ADP Employment Report for March. This report is for private payrolls only (no government). The consensus is for 155,000 payroll jobs added in March, up from 140,000 added in February.
• At 10:00 AM, the ISM Services Index for March.
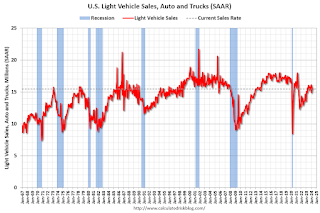
Vehicles Sales Decrease to 15.5 million SAAR in March; Up 4% YoY
by Calculated Risk on 4/02/2024 04:41:00 PM
Wards Auto released their estimate of light vehicle sales for February: Affordability Front-and-Center in March U.S. Light-Vehicle Sales Gain (pay site).
Combined market share of non-luxury small cars and small and midsize CUVs increased to 42.1% in March from same-month-2023’s 36.5%. Thanks to that boost, total deliveries in March increased year-over-year despite a decline in sales of all pickups, SUVs, vans, midsize cars and luxury-priced cars. The trend was largely true over the entire first quarter, as deliveries of more affordable vehicles led the three-month period to a 5.1% year-over-year gain.
 Click on graph for larger image.
This graph shows light vehicle sales since 2006 from the BEA (blue) and Wards Auto's estimate for March (red).
Sales in March (15.49 million SAAR) were down 2.0% from February, and up 3.8% from March 2023.
 Vehicle sales are usually a transmission mechanism for Federal Open Market Committee (FOMC) policy, although far behind housing. This time vehicle sales were more suppressed by supply chain issues and are up year-over-year.
Sales in March were below the consensus forecast.
Freddie Mac House Price Index Increased in February; Up 5.9% Year-over-year
by Calculated Risk on 4/02/2024 01:01:00 PM
Today, in the Calculated Risk Real Estate Newsletter: Freddie Mac House Price Index Increased in February; Up 5.9% Year-over-year
A brief excerpt:
On a year-over-year basis, the National FMHPI was up 5.9% in February, down from up 6.2% YoY in January. The YoY increase peaked at 19.1% in July 2021, and for this cycle, bottomed at up 0.9% YoY in April 2023. ...
As of February, 17 states and D.C. were below their previous peaks, Seasonally Adjusted. The largest seasonally adjusted declines from the recent peak were in West Virginia (-3.1%), Idaho (-2.8%), North Dakota (-2.4%), Oregon (-1.8%), and Nevada (-1.5%).
For cities (Core-based Statistical Areas, CBSA), here are the 30 cities with the largest declines from the peak, seasonally adjusted. Austin continues to be the worst performing city.
BLS: Job Openings Little Changed at 8.8 million in February
by Calculated Risk on 4/02/2024 10:00:00 AM
From the BLS: Job Openings and Labor Turnover Summary
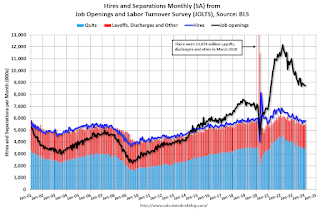
The number of job openings changed little at 8.8 million on the last business day of February, the U.S. Bureau of Labor Statistics reported today. Over the month, the number of hires and total separations were little changed at 5.8 million and 5.6 million, respectively. Within separations, quits (3.5 million) and layoffs and discharges (1.7 million) changed little.The following graph shows job openings (black line), hires (dark blue), Layoff, Discharges and other (red column), and Quits (light blue column) from the JOLTS.
emphasis added
This series started in December 2000.
Note: The difference between JOLTS hires and separations is similar to the CES (payroll survey) net jobs headline numbers. This report is for February; the employment report this Friday will be for March.
 Click on graph for larger image.
Note that hires (dark blue) and total separations (red and light blue columns stacked) are usually pretty close each month. This is a measure of labor market turnover. When the blue line is above the two stacked columns, the economy is adding net jobs - when it is below the columns, the economy is losing jobs.
The spike in layoffs and discharges in March 2020 is labeled, but off the chart to better show the usual data.
Jobs openings were little changed in February at 8.76 million from 8.75 million in January.
The number of job openings (black) were down 11% year-over-year.
Quits were down 12% year-over-year. These are voluntary separations. (See light blue columns at bottom of graph for trend for "quits").
CoreLogic: US Home Prices Increased 5.5% Year-over-year in February
by Calculated Risk on 4/02/2024 08:00:00 AM
Notes: This CoreLogic House Price Index report is for February. The recent Case-Shiller index release was for January. The CoreLogic HPI is a three-month weighted average and is not seasonally adjusted (NSA).
From CoreLogic: CoreLogic: US Annual Home Price Growth Slows but Still Up by Over 5% in February
• U.S. single-family home prices rose by 5.5% year over year in February and are expected to taper to 3.1% growth by February 2025.This was a smaller YoY increase than the 5.8% reported for January.
• Four of the top five states with the highest annual home price growth are in the Northeast: New Jersey, Rhode Island, Maine and Connecticut
• The five states where home prices remain furthest from the summer 2022 peak are Idaho, Washington, Utah, Vermont and Montana
• The Miami and San Diego metro areas continued to lead the country for annual growth in February, both at about 10%
...
U.S. annual home price growth remained mostly consistent with numbers seen since last fall in February but finally slowed as the residual impact of comparing gains with weak 2022 home prices wore off. CoreLogic projects that year-over-year home price gains will continue to rise at a slower pace for the rest of 2024, which suggests more certainty for potential homebuyers who have been waiting to get a foot in the door. As noted in the most recent US CoreLogic S&P Case-Shiller Index report, an increase in for-sale inventory also benefits potential homebuyers, though affordability remains a concern, particularly if mortgage rates remain elevated throughout the spring homebuying season.
“Home price growth pivoted in February, as the impact of the January 2023 Home Price Index bottom finally faded,” said Dr. Selma Hepp, chief economist for CoreLogic. “As a result, the U.S. should begin to see slowing annual home price gains moving forward.”
“Nevertheless,” Hepp continued, “with a 0.7% increase from January to February 2024, which is almost double the monthly increase recorded before the pandemic, spring home price gains are already off to a strong start despite continued mortgage rate volatility. That said, more inventory finally coming to market will likely translate to more options for buyers and fewer bidding wars, which typically keeps outsized price growth in check. Still, despite affordability challenges, homebuyer demand appears to favor already expensive, coastal markets with a limited availability of properties for sale.”
emphasis added
Monday, April 01, 2024
Tuesday: Job Openings, Vehicle Sales
by Calculated Risk on 4/01/2024 07:31:00 PM

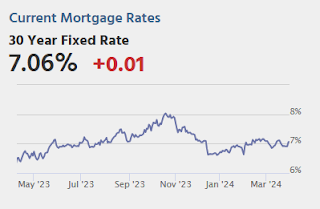
March ended with a streak of some of the flattest day-over-day changes in mortgage rates on record. It was all but certain that the new week/month would bring a change to that sideways trend, but the reality [w]as immediate and abrupt. [30 year fixed 7.05%]Tuesday:
emphasis added
• At 8:00 AM ET, Corelogic House Price index for February.
• At 10:00 AM, Job Openings and Labor Turnover Survey for February from the BLS.
• All Day Light vehicle sales for March. The consensus is for light vehicle sales to be 15.9 million SAAR in March, up from 15.8 million in February (Seasonally Adjusted Annual Rate).
ICE Mortgage Monitor: The Impact of "Golden-Handcuffs" on Mortgage Payments
by Calculated Risk on 4/01/2024 12:21:00 PM
Today, in the Real Estate Newsletter: ICE Mortgage Monitor: The Impact of "Golden-Handcuffs" on Mortgage Payments
Brief excerpt:
Press Release: ICE Mortgage Monitor: Trading Up to a 25% More Expensive Home Would More Than Double the Average Mortgage Holder’s PaymentThere is much more in the article.• From 2000 to 2022, upgrading to a 25% more expensive home would have required the average homeowner to increase their principal and interest payment by roughly 40%, or about $400 per month“Early-payment delinquencies remain elevated”
• Today, that same trade-up buyer’s payment would increase by an average of $1,384 per month, a 103% jump that highlights the real-world pressures keeping current mortgage holders “locked in” to their homes
• Simply giving up their current rate to move across the street to an equivalently priced home in today’s market would result in a nearly 40% increase in P&I – roughly as much as the historical trade-up cost
Here is a graph of the early delinquency rates for Conventional, FHA and VA loans. Conventional loans continue to perform well, but there is concern about FHA and VA loans.
•Early-payment delinquencies remain elevated among recent originations, particularly FHA and VA loan products
• Such delinquencies have edged upward in recent years but remain well below pre-Great Financial Crisis levels, while FHA and conventional mortgages have both improved modestly year over year, with VA loans holding roughly flat
• Though early-payment delinquencies on conventional mortgages remain low, performance of late-2023 FHA and VA loans, originated when rates neared 8% and debt-to-income ratios reached series highs, remain worth watching


