 RSS Feed
 by Calculated Risk on 4/04/2024 08:33:00 PM
Thursday, April 04, 2024
Friday: Employment Report
 Note: Mortgage rates are from MortgageNewsDaily.com and are for top tier scenarios.
Friday:
• At 8:30 AM ET, 8:30 AM: Employment Report for March. The consensus is for 200,000 jobs added, and for the unemployment rate to be unchanged at 3.9%.
March Employment Preview
by Calculated Risk on 4/04/2024 05:03:00 PM
On Friday at 8:30 AM ET, the BLS will release the employment report for March. The consensus is for 200,000 jobs added, and for the unemployment rate to be unchanged at 3.9%.
There were 275,000 jobs added in February, and the unemployment rate was at 3.9%.
From Goldman Sachs economist Spencer Hill
We estimate nonfarm payrolls rose by 240k in March—above consensus ... We estimate that the unemployment rate fell one tenth to 3.8% ... We assume a flat-to-up labor force participation rate of 62.5%. We estimate average hourly earnings rose 0.25% month-over-month, which would lower the year-on-year rate by three tenths to 4.0%—somewhat below consensus.From BofA:
emphasis added
In the March employment report, we forecast nonfarm payrolls to rise by 200k. Despite solid employment, we do not expect to see signs of an economy that is overheating. We think average hourly earnings likely rose by 0.3% m/m, or 4.1% y/y, and average weekly hours likely ticked higher to 34.4. Finally, we expect the unemployment rate to remain at 3.9% and for the participation rate to rise by one-tenth to 62.6%.• ADP Report: The ADP employment report showed 184,000 private sector jobs were added in March. This suggests job gains slightly above consensus expectations, however, in general, ADP hasn't been very useful in forecasting the BLS report.
• ISM Surveys: Note that the ISM services are diffusion indexes based on the number of firms hiring (not the number of hires). The ISM® manufacturing employment index increased in 47.4%, up from 45.9% the previous month. This would suggest about 35,000 jobs lost in manufacturing. The ADP report indicated 1,000 manufacturing jobs added in March.
The ISM® services employment index decreased to 48.5%, from 8.0%. This would suggest about 35,000 jobs added in the service sector. Combined this suggests few jobs added in March, far below consensus expectations.
• Unemployment Claims: The weekly claims report showed a larger number of initial unemployment claims during the reference week from 202,000 in February to 212,000 in March. This suggests slightly more layoffs in March compared to February.
• COVID: As far as the pandemic, the number of patients hospitalized during the reference week in March was around 10,000, down from 17,000 in February.
• Conclusion: Based on the ISM surveys and weekly claims, my guess is employment gains will be below consensus expectations.
Realtor.com Reports Active Inventory UP 25.0% YoY; New Listings Down 7.8% YoY
by Calculated Risk on 4/04/2024 02:44:00 PM
What this means: On a weekly basis, Realtor.com reports the year-over-year change in active inventory and new listings. On a monthly basis, they report total inventory. For February, Realtor.com reported inventory was up 23.5% YoY, but still down almost 38% compared to March 2017 to 2019 levels.
Now - on a weekly basis - inventory is up 25.0% YoY.
Realtor.com has monthly and weekly data on the existing home market. Here is their weekly report: Weekly Housing Trends View—Data Week Ending March 30, 2024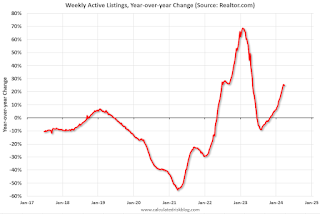 Here is a graph of the year-over-year change in inventory according to realtor.com.
Inventory was up year-over-year for the 21st consecutive week following 20 consecutive weeks with a YoY decrease in inventory.
Realtor.com has monthly and weekly data on the existing home market. Here is their weekly report: Weekly Housing Trends View—Data Week Ending March 30, 2024
• Active inventory increased, with for-sale homes 25.0% above year ago levels.
For an 21st straight week, active listings registered above prior year level, which means that today’s home shoppers are able to consider more options for existing homes for sale. However, the number of homes on the market is still down 37.9% compared to what was typical in 2017 to 2019.
• New listings–a measure of sellers putting homes up for sale–fell this week due to the Easter holiday, by 7.8% from one year ago.
After 22 consecutive weeks of growing new listings, newly listed homes fell below the previous year’s level. However, this decline is in part due to how the Easter holiday fell this year compared to last year. Even without the impact of the Holiday, the annual growth rate of new listings took a step back compared to the last couple of months. Taking a broader look, the number of new homes for sale remains historically small, even with recent improvements.
 Here is a graph of the year-over-year change in inventory according to realtor.com.
 Inventory was up year-over-year for the 21st consecutive week following 20 consecutive weeks with a YoY decrease in inventory.
Inventory is still historically very low.
New listings remain below typical pre-pandemic levels although generally increasing. The YoY decline this week was probably related to the Easter holiday. New listings had been up YoY for 22 consecutive weeks.
Moody's: Apartment Vacancy Rate Unchanged in Q1; Office Vacancy Rate at Record High
by Calculated Risk on 4/04/2024 11:37:00 AM
Today, in the Calculated Risk Real Estate Newsletter: Moody's: Apartment Vacancy Rate Unchanged in Q1; Office Vacancy Rate at Record High
A brief excerpt:
From Moody’s:There is much more in the article.The office sector slashed its vacancy record set just a quarter ago and marched another 20 bps closer to the 20% mark. Sitting at 19.8% in Q1 2024, this new record high vacancy rate is 50 bps above the recessionary peaks recorded in 1986 and 1991. Another quarter of vacancy increase emphasizes the long-term ramifications of hybrid work models, despite positive employment and GDP trends in the current economic cycle. ...Moody’s Analytics reported that the office vacancy rate was at 19.8% in Q1 2024, up from 19.6% in Q4 2023. This is a new record high, and above the 19.3% during the S&L crisis.

Trade Deficit at $68.9 Billion in February
by Calculated Risk on 4/04/2024 08:44:00 AM
The Census Bureau and the Bureau of Economic Analysis reported:
The U.S. Census Bureau and the U.S. Bureau of Economic Analysis announced today that the goods and services deficit was $68.9 billion in February, up $1.3 billion from $67.6 billion in January, revised.
February exports were $263.0 billion, $5.8 billion more than January exports. February imports were $331.9 billion, $7.1 billion more than January imports.
emphasis added
 Click on graph for larger image.
Both exports imports increased in February.
Exports are up 4.1% year-over-year; imports are up 2.8% year-over-year.
Both imports and exports decreased sharply due to COVID-19 and then bounced back - imports and exports have increased recently.
The second graph shows the U.S. trade deficit, with and without petroleum.
 The blue line is the total deficit, and the black line is the petroleum deficit, and the red line is the trade deficit ex-petroleum products.
Note that net, exports of petroleum products are positive and have been increasing.
The trade deficit with China increased to $19.9 billion from $19.0 billion a year ago.
Weekly Initial Unemployment Claims Increase to 221,000
by Calculated Risk on 4/04/2024 08:30:00 AM
The DOL reported:
In the week ending March 30, the advance figure for seasonally adjusted initial claims was 221,000, an increase of 9,000 from the previous week's revised level. The previous week's level was revised up by 2,000 from 210,000 to 212,000. The 4-week moving average was 214,250, an increase of 2,750 from the previous week's revised average. The previous week's average was revised up by 500 from 211,000 to 211,500.The following graph shows the 4-week moving average of weekly claims since 1971.
emphasis added
 Click on graph for larger image.
The dashed line on the graph is the current 4-week average. The four-week average of weekly unemployment claims increased to 214,250.
The previous week was revised up.
Weekly claims were higher than the consensus forecast.
Wednesday, April 03, 2024
Thursday: Unemployment Claims, Trade Deficit
by Calculated Risk on 4/03/2024 07:41:00 PM
 Note: Mortgage rates are from MortgageNewsDaily.com and are for top tier scenarios.
Thursday:
• At 8:30 AM ET, The initial weekly unemployment claims report will be released. The consensus is for 208 thousand initial claims, down from 210 thousand last week.
• Also at 8:30 AM: Trade Balance report for February from the Census Bureau. The consensus is the trade deficit to be $66.5 billion. The U.S. trade deficit was at $67.4 billion in January.
Heavy Truck Sales Decreased in March
by Calculated Risk on 4/03/2024 03:43:00 PM
This morning, the BEA released their estimate of vehicle sales for March.
This graph shows heavy truck sales since 1967 using data from the BEA. The dashed line is the March 2024 seasonally adjusted annual sales rate (SAAR).
Heavy truck sales really collapsed during the great recession, falling to a low of 180 thousand SAAR in May 2009. Then heavy truck sales increased to a new record high of 570 thousand SAAR in April 2019.
 Click on graph for larger image.
Note: "Heavy trucks - trucks more than 14,000 pounds gross vehicle weight."
Heavy truck sales declined sharply at the beginning of the pandemic, falling to a low of 308 thousand SAAR in May 2020.
Heavy truck sales were at 478 thousand SAAR in March, down from 499 thousand in February, and down 6.1% from 509 thousand SAAR in March 2023.
Usually, heavy truck sales decline sharply prior to a recession. Heavy truck sales are solid.
Asking Rents Mostly Unchanged Year-over-year
by Calculated Risk on 4/03/2024 12:56:00 PM
Today, in the Real Estate Newsletter: Asking Rents Mostly Unchanged Year-over-year
Brief excerpt:
Here is a graph of the year-over-year (YoY) change for these measures since January 2015. Most of these measures are through February 2024, except CoreLogic is through January and Apartment List is through March 2024.There is much more in the article.
The CoreLogic measure is up 2.6% YoY in January, down from 2.8% in December, and down from a peak of 13.9% in April 2022.
The Zillow measure is up 3.6% YoY in February, mostly unchanged from 3.6% YoY in January, and down from a peak of 16.1% YoY in February 2022.
The ApartmentList measure is down 0.8% YoY as of March, mostly unchanged from -0.9% in February, and down from a peak of 17.8% YoY November 2021..
...
The Rent of primary residence was up 5.8% YoY in February down from up 6.1% YoY in January. The Owners’ Equivalent Rent (OER) was up 6.0% YoY in February down from 6.2% YoY in January. The YoY change in OER and in PCE housing have peaked, but will stay elevated for some time, even though asking rent growth has mostly flattened YoY.

ISM® Services Index decreases to 51.4% in March
by Calculated Risk on 4/03/2024 10:00:00 AM
(Posted with permission). The ISM® Services index was at 51.4%, down from 52.6% last month. The employment index increased to 48.5%, from 48.0%. Note: Above 50 indicates expansion, below 50 in contraction.
From the Institute for Supply Management: Services PMI® at 51.4% March 2024 Services ISM® Report On Business®
Economic activity in the services sector expanded in March for the 15th consecutive month as the Services PMI® registered 51.4 percent, say the nation's purchasing and supply executives in the latest Services ISM® Report On Business®. The sector has grown in 45 of the last 46 months, with the lone contraction in December 2022.The PMI was below expectations.
The report was issued today by Anthony Nieves, CPSM, C.P.M., A.P.P., CFPM, Chair of the Institute for Supply Management® (ISM®) Services Business Survey Committee: “In March, the Services PMI® registered 51.4 percent, 1.2 percentage points lower than February’s reading of 52.6 percent. The composite index indicated growth in March for the 15th consecutive month after a reading of 49 percent in December 2022, which was the first contraction since May 2020 (45.4 percent). The Business Activity Index registered 57.4 percent in March, which is 0.2 percentage point higher than the 57.2 percent recorded in February. The New Orders Index expanded in March for the 15th consecutive month after contracting in December 2022 for the first time since May 2020; the figure of 54.4 percent is 1.7 percentage points lower than the February reading of 56.1 percent. The Employment Index contracted for the third time in four months with a reading of 48.5 percent, a 0.5-percentage point increase compared to the 48 percent recorded in February.
emphasis added


